SGX Market Updates

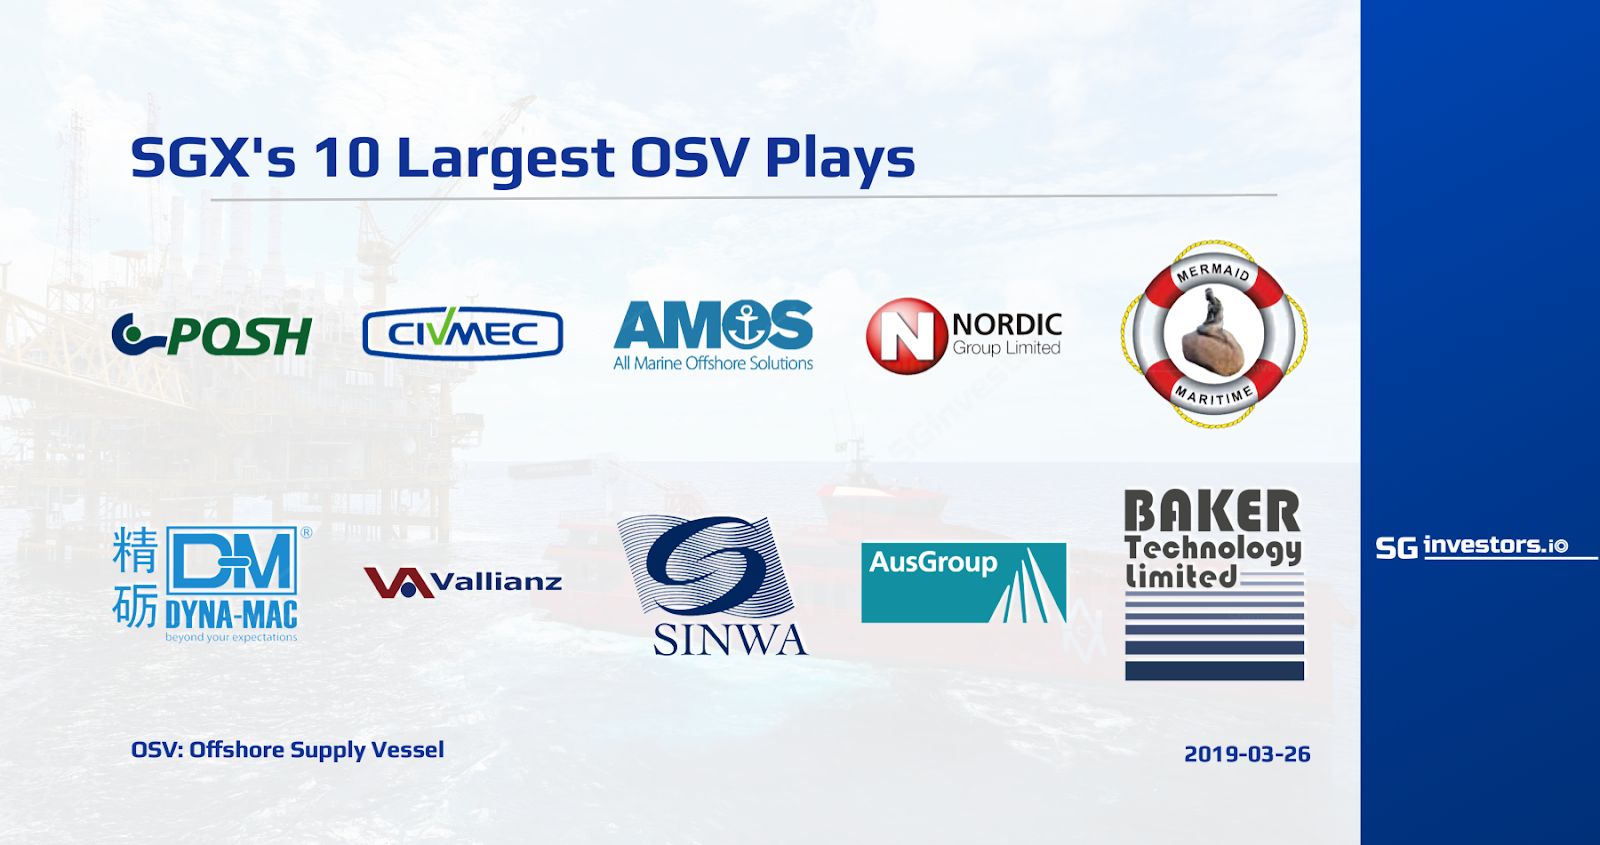
Highlights of SGX’s 10 Largest OSV Plays


PUBLISHED ON |

26 March 2019

  • SGX's 10 largest OSV stocks, with a combined market cap of more than S$1 billion, have averaged a 30.9% price rebound from their 52W lows, in line with recent crude gains. The five that posted the strongest price rebound from their 12M troughs were: Amos Group (160.9%), Sinwa (57.9%), Vallianz (30.0%), Dyna-Mac (23.0%), and Baker Technology (9.2%).

  • 5 of the 10 largest OSV stocks also saw increased average daily trading values over the past 1M, compared with the preceding 3M. The largest relative increases in trading turnover were generated by Dyna-Mac (83.8%), Baker Technology (57.1%), AusGroup (44.7%), Sinwa (31.9%), and Nordic Group (18.8%).

  • Since the start of 2019, WTI crude has gained more than 30%, supported by production cuts from OPEC and its partners, in addition to supply disruptions in Iran and Venezuela following US sanctions. Last week, oil prices hit a 4M high of US$60/bbl.


Singapore Exchange lists 35 Offshore Supply Vessel (OSV) players. These companies provide support services to offshore drilling rigs, pipe laying and oil-producing assets – including production platforms as well as floating production, storage and offloading (FPSO) units – used in the exploration and production (E&P) of oil and gas (O&G). 

OSV stocks are heavily dependent on the fortunes of the crude market. They are widely viewed as one of the key beneficiaries of a rebound in oil prices. A robust demand for oil leads to an increase in planned E&P activities, resulting in higher demand for rigs, platforms and FPSOs, which in turn boosts the OSV market.


Crude Hit 4M Highs Last Week

Since the start of 2019, WTI crude has gained over 30%, supported by production cuts from the Organization of Petroleum Exporting Countries (OPEC) and its partners – known as OPEC+, in addition to supply disruptions in Iran and Venezuela following US sanctions. After hitting a four-month high of US$60 a barrel last week, oil prices have since retreated, as risk-off sentiment increased on continued uncertainty over the US-China trade war and disappointing economic data from US and Europe. Saudi Arabia signalled earlier this month that producers may need to extend their 1.2 million barrels per day of supply curbs past June into the second half of the year, as OPEC’s job of rebalancing the oil market was far from done.

WTI Crude


Price Recovery From 12M Troughs

The 10 largest OSV stocks on SGX have a combined market capitalisation of more than S$1 billion. These 10 largest players have also averaged a 30.9% price rebound from their 52-week lows, in line with recent crude gains. Among the 10, five that posted the strongest price rebound from their 12-month troughs were: Amos Group (160.9%), Sinwa Ltd (57.9%), Vallianz Holdings (30.0%), Dyna-Mac Holdings (23.0%), and Baker Technology (9.2%).

The table below details the current and 52-week low prices for the 10 largest OSV stocks, sorted by market capitalisation.

Name SGX
Code
Market
Cap
(S$m)
Last
Price
(S$)
52W Low
Price
(S$)
52W Low
Date
% Chg
vs
52W Low
PACC OFFSHORE SERVICES U6C 323 0.178 0.170 01/02/2019 4.7
CIVMEC LTD P9D 200 0.400 0.380 03/07/2019 5.3
AMOS GROUP RF7 156 0.060 0.023 03/12/2019 160.9
NORDIC GROUP MR7 130 0.330 0.305 03/11/2019 8.2
MERMAID MARITIME DU4 116 0.082 0.077 10/29/2018 6.5
DYNA-MAC HOLDINGS NO4 109 0.107 0.087 01/22/2019 23.0
VALLIANZ HOLDINGS WPC 109 0.195 0.150 12/20/2018 30.0
SINWA LTD 5CN 102 0.300 0.190 08/02/2018 57.9
AUSGROUP LTD 5GJ 85 0.028 0.027 03/08/2019 3.7
BAKER TECHNOLOGY BTP 84 0.415 0.380 03/12/2019 9.2

Source: Bloomberg & StockFacts (data as of 22 March 2019)


Recent Performances

In the 2019 year-to-date, the 10 largest OSV stocks have averaged a total return of +9.8%, bringing their one-year and three-year total returns to -26.0% and -22.4% respectively. The 3 best-performing OSV players in the YTD were: Amos Group (+160.9%), Sinwa (+15.4%), and PACC Offshore Services (+0.6%).

The table below details the year-to-date, one-year and three-year total returns for the 10 largest OSV stocks, sorted by YTD returns.

Name SGX
Code
Market
Cap
S$m
Total
Return
YTD
(%)
Total
Return
1Y
(%)
Total
Return
3Y
(%)
P/E P/B
AMOS GROUP RF7 101 160.9 11.1 -82.4 NA 1.3
SINWA LTD 5CN 101 15.4 41.1 60.0 NA 1.2
PACC OFFSHORE SERVICES U6C 319 0.6 -53.8 -49.9 NA 0.7
CIVMEC LTD P9D 200 0.0 -22.7 4.9 8.2 1.2
BAKER TECHNOLOGY BTP 85 -2.4 -32.5 -50.2 4.7 0.3
MERMAID MARITIME DU4 114 -5.7 -47.4 -23.4 NA 0.3
DYNA-MAC HOLDINGS NO4 108 -6.1 -24.1 -24.6 71.0 1.0
AUSGROUP LTD 5GJ 85 -12.5 -41.1 -76.8 5.4 0.9
NORDIC GROUP MR7 130 -17.5 -40.7 103.9 11.3 1.6
VALLIANZ HOLDINGS WPC 109 -35.0 -50.0 -85.9 7.5 0.3
Average 9.8 -26.0 -22.4

Source: Bloomberg & StockFacts (data as of 22 March 2019)


This article is provided by SGX My Gateway.


SGX My Gateway

SGX's investor education portal with market, product and investment information and events. Sign up now at sgx.com/mygateway to receive our investment updates and economic calendar.

This document is not intended for distribution to, or for use by or to be acted on by any person or entity located in any jurisdiction where such distribution, use or action would be contrary to applicable laws or regulations or would subject Singapore Exchange Limited (“SGX”) to any registration or licensing requirement. This document is not an offer or solicitation to buy or sell, nor financial advice or recommendation for any investment product. This document is for general circulation only. It does not address the specific investment objectives, financial situation or particular needs of any person. Advice should be sought from a financial adviser regarding the suitability of any investment product before investing or adopting any investment strategies. Use of and/or reliance on this document is entirely at the reader’s own risk. Further information on this investment product may be obtained from www.sgx.com. Investment products are subject to significant investment risks, including the possible loss of the principal amount invested. Past performance of investment products is not indicative of their future performance. Examples provided are for illustrative purposes only. While each of SGX and its affiliates (collectively, the SGX Group Companies) have taken reasonable care to ensure the accuracy and completeness of the information provided, each of the SGX Group Companies disclaims any and all guarantees, representations and warranties, expressed or implied, in relation to this document and shall not be responsible or liable (whether under contract, tort (including negligence) or otherwise) for any loss or damage of any kind (whether direct, indirect or consequential losses or other economic loss of any kind, including without limitation loss of profit, loss of reputation and loss of opportunity) suffered or incurred by any person due to any omission, error, inaccuracy, incompleteness, or otherwise, any reliance on such information, or arising from and/or in connection with this document. The information in this document may have been obtained via third party sources and which have not been independently verified by any SGX Group Company. No SGX Group Company endorses or shall be liable for the content of information provided by third parties. The SGX Group Companies may deal in investment products in the usual course of their business, and may be on the opposite side of any trades. SGX is an exempt financial adviser under the Financial Advisers Act (Cap. 110) of Singapore. The information in this document is subject to change without notice. This document shall not be reproduced, republished, uploaded, linked, posted, transmitted, adapted, copied, translated, modified, edited or otherwise displayed or distributed in any manner without SGX’s prior written consent.


SGX Stock / REIT Search

Advertisement

Trust Bank God Of Fortune Referral Code PGKPSWAE Trust Bank Referral Code 🎁

Advertisement