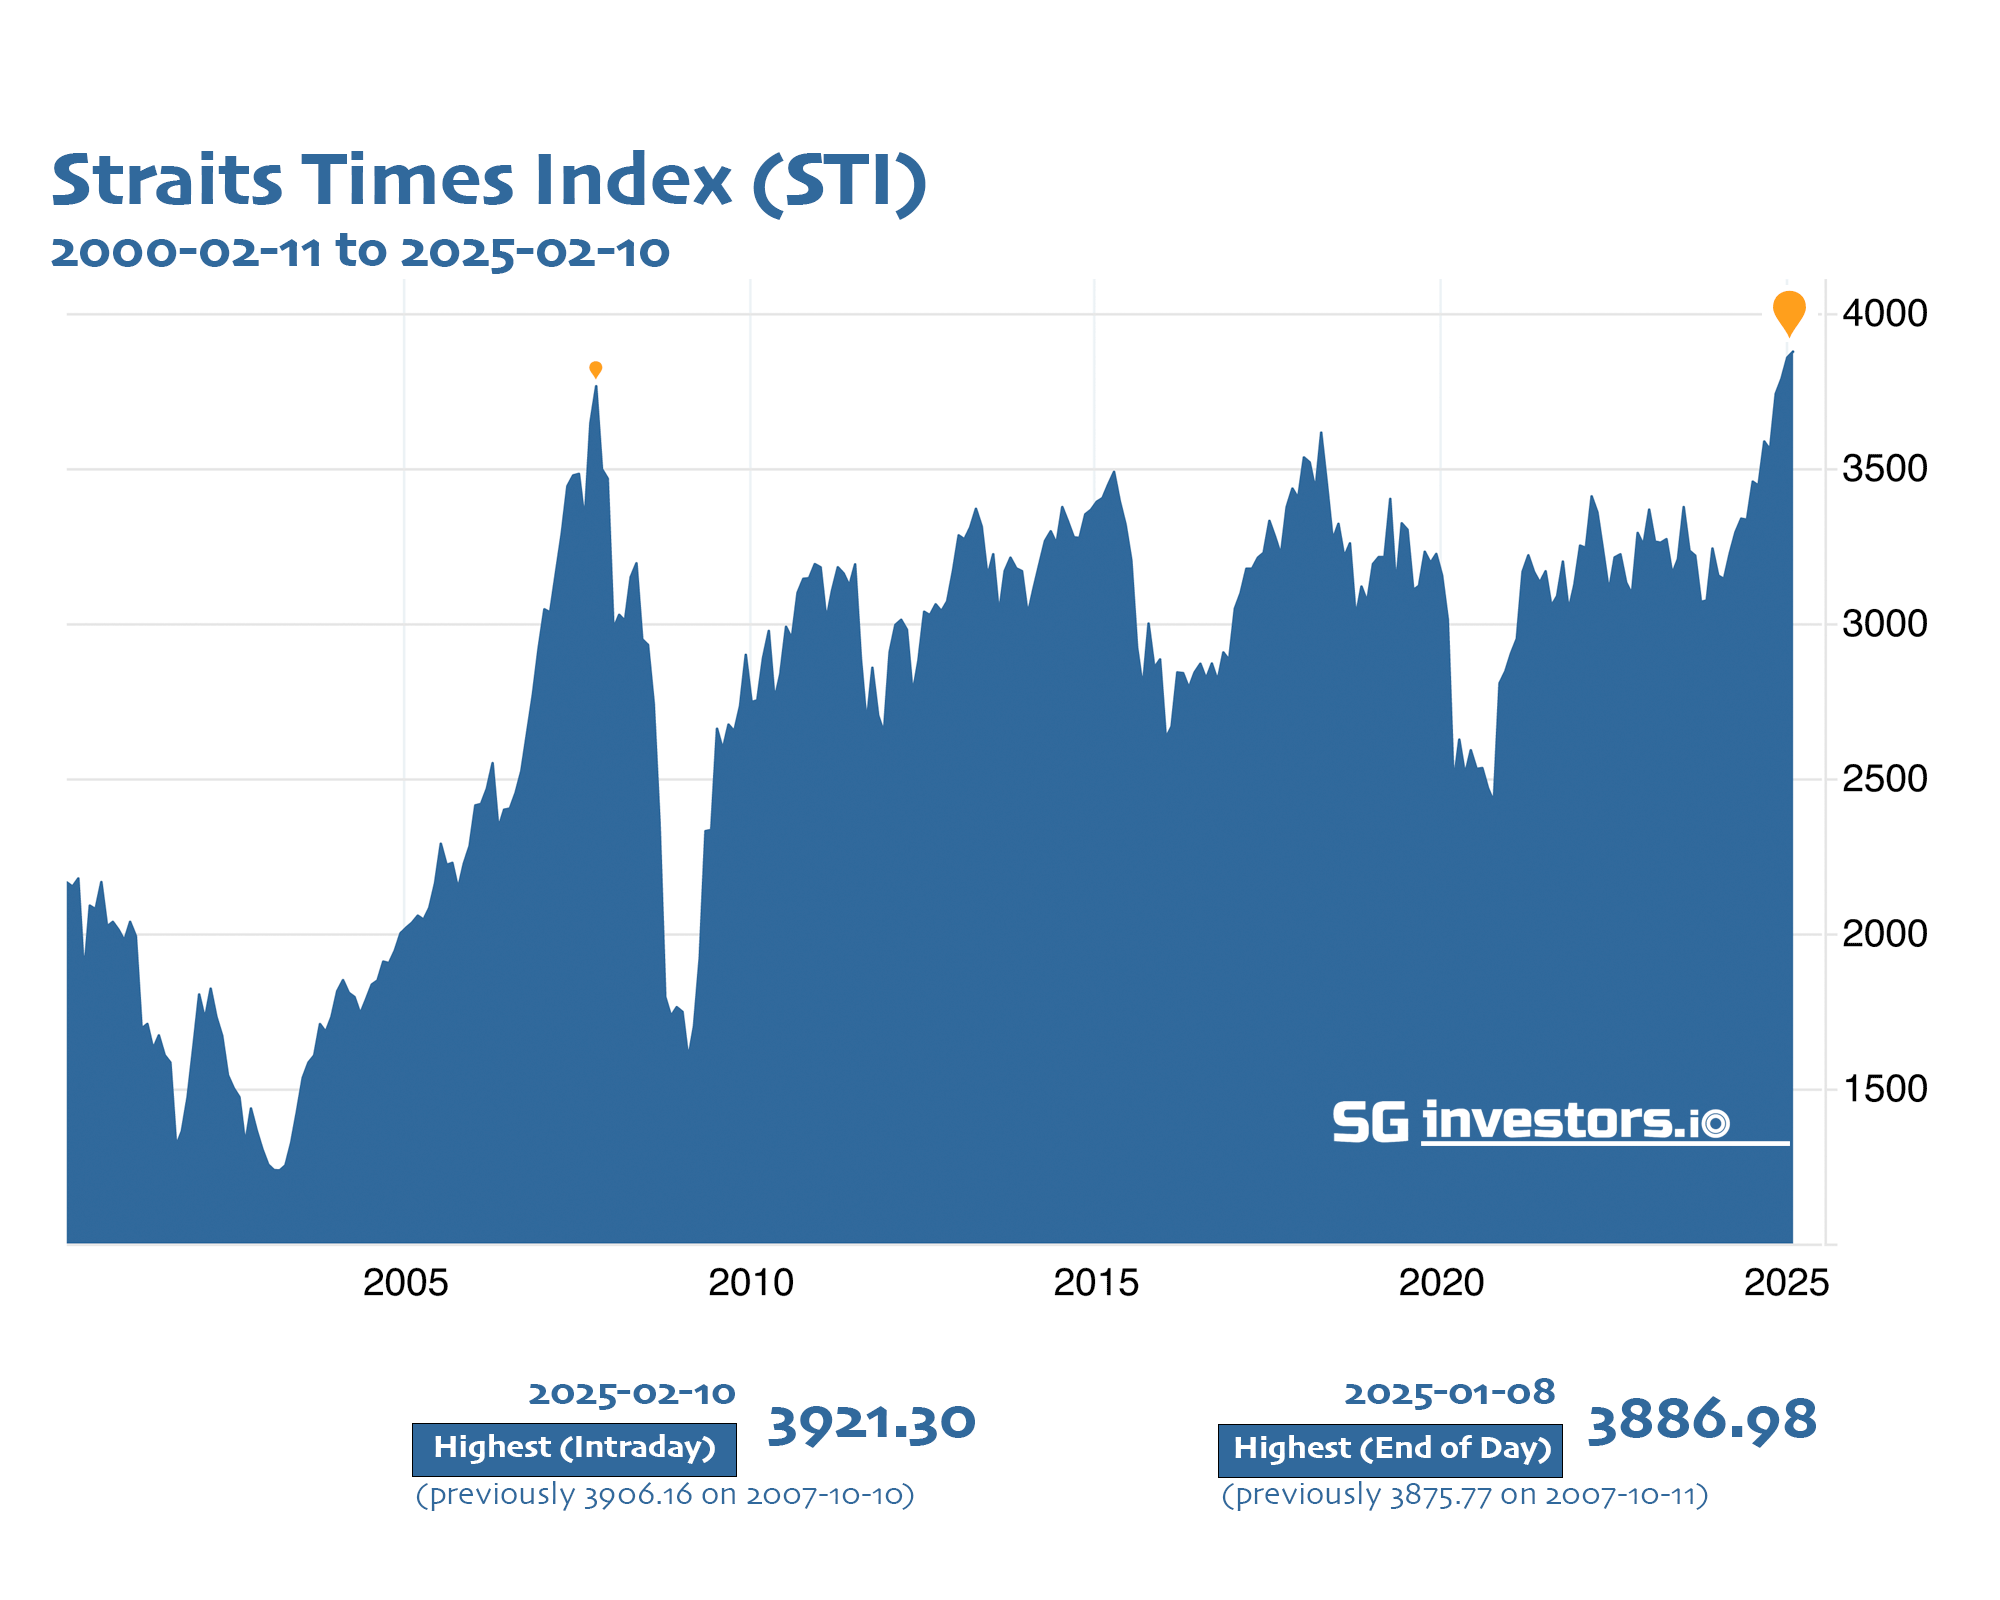
Over the 10 months spanning April 17, 2024 to Feb 10, 2025, the Straits Times Index (STI) surged 23.2% to a record high of 3,921.30, despite gains being unevenly distributed among constituents, with three gainers for every two decliners. The STI also booked net institutional inflow of S$489 million over the 10-month period.
-
Singtel, UOB, SGX, OCBC, and ST Engineering booked the most net institutional inflow over the 10-month period, while Yangzijiang Shipbuilding saw the strongest gains among the STI constituents with a 65% price gain, followed by SGX gaining 53% and Hongkong Land gaining 45%.
-
Over the 10 months, the trio of banks averaged 33% price gains, increasing their combined STI weightage from 50% to 54%. DBS reported FY24 financials on Feb 10, driving the STI to the new all-time high, while reporting a record net profit of S$11.4 billion for its FY24, and announcing plans to manage excess capital over the next three years.
Over the past 10 months, the Straits Times Index (STI) has made its most significant charge towards its October 2007 all-time high in 17 years, culminating in a new record high of 3,921.30 on February 10. Despite this key milestone, the gains among STI constituents were not broad-based over the 10-month period. There were as many as two decliners for every three gainers spanning the 730-point rise from the 3,144.76 close on April 16 to the 3,875.13 close on February 10. Before closing at 3,875.13 on February 10, the STI surpassed its preceding October 2007 high of 3,906.16, with the aforementioned 3,921.30 high.
The past 10 months of gains were not entirely linear for the STI, with some bouts of market uncertainty and increased STI volatility, especially in August 2024, due to the unwinding of the US$/JPY carry trade and fleeting fears of a US economic hard landing. However, the overall bid tone in both the US and China stock markets over the 10 months saw, the S&P 500 Index generate a 19% price gain and CSI 300 generate a 9% price gain over the same 10-month period, in S$ terms.
The STI’s 23.2% price gain was accompanied by a net institutional inflow of S$489 million. The 5 STI stocks that booked the most net institutional inflow over the 10-month period included
- SingTel,
- UOB,
- SGX,
- OCBC, and
- ST Engineering.
Yangzijiang Shipbuilding Led the STI in 2024, 2022, 2021 and 2017.
Yangzijiang Shipbuilding led the STI constituents over the 10-month period. Established over six decades ago, the Group has since become one of the largest non-state-owned shipbuilding companies in China. The stock also led the STI in 2022, 2021, and 2017. Since the beginning of 2017, the Jiangsu Province-based shipbuilder has tripled its weight in the STI and seen its share price rise sixfold from less than S$0.45 to near S$3.00.
Additionally, since 2017, the value of its works-in-progress order book has grown sixfold, increasing from 85 vessels valued at US$4.3 billion in early 2017, to an estimated 245 vessels worth US$24.8 billion on December 2, 2024. Note this does not include any ships completed between the November 7, 3QFY24 Business Update and December 2 announcement of new contracts entered into by the Group.
Hongkong Land's Strategic Shift
Hongkong Land also made it among the three best-performing STI stocks over the 10 months, thanks to its new strategy focusing on ultra-premium integrated commercial properties in Hong Kong, Singapore, and Shanghai. The company aims to be the leader in Asia’s gateway cities by 2035. Their strategic review will see the Group redirect third-party and recycled capital to new ventures after completing current projects.
The financial goals for 2035 are to double underlying profit before interest and tax with no single city accounting for more than 40%, double dividends per share, grow assets under management to US$100 billion with significant third-party capital, and actively recycle up to US$10 billion in capital.
The STI constituents and their performances over the 10-month period are tabled below. You may click on the column header to sort the table accordingly.
STI Constituent | SGX Code |
Market Cap S$m |
16Apr2024- 10Feb2025 Price Change % |
16Apr2024- 10Feb2025 Net Institutional Inflow S$m |
Sector |
---|---|---|---|---|---|
Yangzijiang | BS6 | 11,812 | 65 | 61.09 | Industrials |
SGX | S68 | 14,666 | 53 | 468.00 | Financial Services |
Hongkong Land | H78 | 12,571 | 45 | 22.89 | Real Estate (excl. REITs) |
SingTel | Z74 | 54,619 | 43 | 979.64 | Telecommunications |
DBS | D05 | 128,862 | 40 | 44.07 | Financial Services |
Seatrium | 5E2 | 7,244 | 37 | 35.27 | Industrials |
SATS | S58 | 4,803 | 31 | 111.47 | Industrials |
UOB | U11 | 63,134 | 29 | 679.75 | Financial Services |
OCBC | O39 | 78,183 | 29 | 242.55 | Financial Services |
DFI Retail | D01 | 4,352 | 29 | -1.59 | Consumer Non-Cyclicals |
ST Engineering | S63 | 15,257 | 27 | 213.30 | Industrials |
Jardine Matheson | J36 | 15,328 | 10 | -0.81 | Industrials |
CapitaLand Integrated Commercial Trust | C38U | 14,524 | 7 | -178.72 | REITs |
Thai Beverage | Y92 | 12,817 | 6 | 30.66 | Consumer Non-Cyclicals |
Jardine Cycle & Carriage | C07 | 10,557 | 4 | 31.91 | Consumer Cyclicals |
Sembcorp | U96 | 9,557 | 3 | 92.34 | Utilities |
SIA | C6L | 18,791 | 2 | -419.44 | Industrials |
CapitaLand Ascendas REIT | A17U | 11,661 | 1 | -315.93 | REITs |
Frasers Centrepoint Trust | J69U | 3,837 | -1 | -89.86 | REITs |
Keppel | BN4 | 12,173 | -2 | -69.94 | Industrials |
CapitaLand Investment | 9CI | 12,259 | -3 | -156.25 | Financial Services |
Mapletree Pan Asia Commercial Trust | N2IU | 6,268 | -4 | -110.63 | REITs |
Wilmar | F34 | 20,226 | -4 | -135.78 | Consumer Non-Cyclicals |
Mapletree Industrial Trust | ME8U | 6,067 | -6 | -199.73 | REITs |
UOL Group | U14 | 4,317 | -9 | -36.04 | Real Estate (excl. REITs) |
City Developments | C09 | 4,503 | -10 | -201.91 | Real Estate (excl. REITs) |
Venture Corp | V03 | 3,699 | -10 | -71.90 | Technology (Hardware/ Software) |
Mapletree Logistics Trust | M44U | 6,171 | -13 | -154.49 | REITs |
Frasers Logistics & Commercial Trust | BUOU | 3,254 | -15 | -131.69 | REITs |
Genting Singapore | G13 | 8,994 | -18 | -248.97 | Consumer Cyclicals |
Source: SGX & Refinitv. All Data as of 10 February 2025.
The trio of STI banks - DBS, OCBC and UOB averaged 33% price gains over the 10 months, with their combined weightage in the STI increasing from 50% on April 17, 2024 to 54% on February 10, 2025.
DBS, the largest weight in the STI, reported pre-market on Monday, February 10. The market's reaction to its results propelled the STI from a Friday close of 3,861.42 to a new all-time high of 3,921.30 shortly after the Monday open.
DBS FY24 Results & Capital Management Plans
DBS reported a record net profit of S$11.4 billion for its FY24 (ended Dec 31), up 11% from FY23, with a return on equity (ROE) of 18.0%. Total income grew 10% to S$22.3 billion, driven by an expanded net interest margin (NIM), fee income surpassing S$4 billion, and strong treasury customer sales. The cost-income ratio remained stable at 40%, and asset quality was sound with specific allowances at 13 basis points of loans. DBS intends to distribute S$2.22 per share in dividends for FY24, totaling S$6.3 billion, a 27% increase from FY23.
DBS also plans to manage excess capital over the next three years, starting with a Capital Return dividend of 15 cents per share per quarter in 2025. Similar amounts are expected to be paid out in the following two years through various mechanisms. This Capital Return dividend is part of ongoing capital management initiatives, including regular dividend increases, special dividends, and a share buyback program. The Board will continue exploring all forms of returning capital.
DBS’ CEO and Deputy CEO expect FY25 net interest income to be slightly above FY24 levels based on two rate cuts in 2H25, with a slight decline in Group NIM, to be offset by loan growth. The Group also expect commercial book non-interest income growth to be high-single digits, led by growth in wealth management fees and treasury customer sales. Net profit is also expected to be below 2024 levels due to the global minimum effective tax rate of 15% to be introduced for large Singapore multinational enterprises.
Refer to Earnings Calendar -
STI Total Returns, Revamps & ETFs
The overall total return of the STI during the 10-month period came to 29.2%. Given the STI's relatively high dividend yield, it's unsurprising that between its October 2007 and February 2025 highs, the STI generated a 95% total return, driven by reinvested dividend distributions.
During the 17 years and four months, the trio of STI banks increased their combined STI weightage from 28% to 54%, while REITs increased their combined weightage from 3% to 10%. The STI was also revamped and relaunched in January of 2008, which saw the number of constituents reduced from 47 stocks to 30 stocks. The STI’s current price-to-book (P/B) ratio of 1.3x is less stretched than the 2.5x levels observed in October 2007, indicating a more conservative comparative valuation despite the STI’s robust performance over the past 10 months.
In 2024, the two Exchange Traded Funds (ETFs) tracking the STI saw their combined AUM surpass S$2.5 billion for the first time on November 19, 2024. These two ETFs are the SPDR® Straits Times Index ETF (ES3) and Nikko AM Singapore STI ETF (G3B).Despite the significant growth in the number of Singapore’s ETF offerings since 2020, these two STI ETFs still account for more than one-fifth of the combined AUM of all Singapore-listed ETFs. The systematic access to the STI ETFs through dollar-cost averaging programs and digiportfolio platforms has been integral to their AUM growth which stood at S$2.59 billion as of February 10.
Caveats on STI Consensus
According to Bloomberg, the current 12-month consensus estimate target price (CETP) for the STI is now around 4,200. This figure is derived from the target prices of the STI constituents, appropriately weighted according to their index weights.
Historically, the 12-month CETP for the STI has for the most part been around 10% higher than the prevailing benchmark level. The CETP for the STI started 2024 at 3,640 and had increased to above 3,800 after the STI reached fresh six-year highs near 3,500 in July. The key caveat to CETPs is that they are based on prevailing opinions. They may not be achieved, and when downside risks to the stocks materialise, they can be subject to downward revision. Singapore's consensus economic outlook for 2025 is cautiously optimistic, anticipating steady growth, moderating inflation, and ongoing global uncertainties that include geopolitical and trade tensions, and the outlook for global financial conditions.
See also: