SGX Market Updates

Potential Drivers of the Straits Times Index in 4Q20


PUBLISHED ON |

07 October 2020

  • Singapore is expected to show signs of a 3Q20 recovery in its highly services-orientated economy from 2Q20 following the lifting of CB Measures. The advanced 3Q20 GDP estimates due by 14 Oct will also help set a tone for multiple business updates and outlooks expected by Singapore stocks from mid-October to mid-Nov.

  • External market drivers will include the COVID-19 resurgence and potential vaccine developments, the US Presidential Election and push for further stimulus. Additional drivers will include China’s economic recovery, ongoing technology sector growth, in addition to currency volatility from political tensions & developments. 

  • For the remainder of the 2020, the Banks, Real Estate and Industrial Sectors will be large determinants of the STI’s performance which will take cues from both these domestic and external drivers. Since 1985, the STI has averaged a 4% gain in the fourth quarter of the year.


4Q20 Started with Positive Data Prints 

The Singapore economy has entered 4Q20 on a positive note, with the preliminary 3Q20 URA Private Home Price Index gaining 0.8% from 2Q20, which in turn gained 0.3% from 1Q20. SIPMM also reported that Singapore’s manufacturing PMI in September rose 0.2 points to 50.3, with the Electronics PMI at 50.9, the highest level since September 2018. While technology stocks have been comparatively strong in Singapore, service-orientated stocks across banking, industrial services, tourism, hospitality and transportation have been more impacted by the Circuit Breaker (“CB”) measures and social distancing, as have real estate management and development stocks.

Henceforth, policy-makers are expected to be looking for broader, less uneven and gradually paced growth, structurally sustained through measures to support jobseekers and upskill workers. Key sectors that will remain in focus are the travel-related, consumer-facing domestic services and construction. 


Advanced 3Q20 Growth Estimates to Set Further Tone for 4Q20 

While Singapore’s August manufacturing numbers were also reported to be particularly strong albeit uneven on 25 September, like most advanced economies, Singapore’s GDP is most generated from service-generating industries. Advanced estimates for 3Q20 GDP growth in Singapore are due to be released no later than 14 October and will be largely based on information for July and August.

Consensus expectations are for Singapore’s GDP growth to be down 6.5% y-o-y, yet up more than 30% q-o-q, which follows sharp 2Q20 declines. Such a reading would indicate that much of Singapore economy is on gradual-paced economic recovery. As illustrated below, activity by service producing industries has a much stronger impact on Singapore GDP than goods producing industries, such as manufacturing and construction.


Singapore YOY GDP % Growth


Approximately 70% of Singapore’s GDP comes from services industries with about 25% emanating from goods-producing industries. The less than 5% balance is generated by housing services provided by owner-occupiers and individuals who let out their residential properties. 

The service producing industries comprise multiple sectors highly relevant to Straits Times Index (STI) and the broader stock market such as wholesale and retail trade, business services, finance and insurance, transportation, information and communications. For the 1H20 financial reports, multiple corporate outlooks signalled vigilant intentions to continue building resilience by containing costs, boosting productivity, and where possible seeking opportunities to enhance value. 

The MAS is also scheduled to release its semi-annual monetary policy statement no later than 14 October and is expected to maintain the zero percent per annum rate of appreciation of the policy band announced on 30 March. 


STI’s Recent Strongest 4Q Performers 

Heavyweight stocks have a significant impact on the performance of the STI. Over the past 5 years, the 3 strongest fourth quarters were in 2017 (5.7%), then 2019 (3.3%) and 2015 (3.3%). In each of those 3 years, 3 of 4 of the STI’s big service-orientated heavyweights of DBS Group Holdings, United Overseas Bank and SingTel were amongst the 5 strongest current STI stocks of the fourth quarter. There was also a wide latitude of stocks appearing as the strongest performers in the final quarter of the year from 2015 through to 2019.

As tabled below, this vibrancy is exemplified with as many as 20 of the STI’s current 30 stocks ranking amongst the strongest 5 stocks in at least one of the final quarters of the past 5 years. Stocks that were among the top 5 performers more than once included DBS Group Holdings, Jardine Cycle & Carriage, Keppel Corporation, Venture Corporation and Wilmar International


STI Stock 2015 4Q Return (%)
Jardine Cycle & Carriage 29.0
CapitaLand 25.0
Wilmar International 14.4
SGX 10.3
UOB 6.8
STI Stock 2016 4Q Return (%)
Genting Singapore 22.6
DBS Group 12.7
Wilmar International 11.5
Sembcorp Industries 10.0
Venture Corporation 9.5
STI Stock 2017 4Q Return (%)
DBS Group 19.4
CapitaLand Commercial Trust 16.6
Venture Corporation 16.0
SATS 14.1
Keppel Corporation 13.3
STI Stock 2018 4Q Return (%)
Jardine Matheson 10.6
Jardine Cycle & Carriage 10.5
Mapletree Commercial Trust 3.9
CapitaLand Mall Trust 3.9
Mapletree Logistics Trust 2.4
STI Stock 2019 4Q Return (%)
Yangzijiang Shipbuilding 16.7
Keppel Corporation 14.2
City Developments 11.5
SingTel 10.9
UOL Group 10.9

Source: SGX, Bloomberg and Refinitiv (Data as of 6 October). Note based on current STI stocks.


For the remainder of the 2020, the Bank, Real Estate and Industrial Sectors will be large determinants of the STI’s performance. These mega sectors, built on traditional strengths of the Singapore economy, will take their cues from the state of the economic activity both at home and abroad, as they have throughout the 2020 year-to-date. 


STI’s Past 4Q Performances  

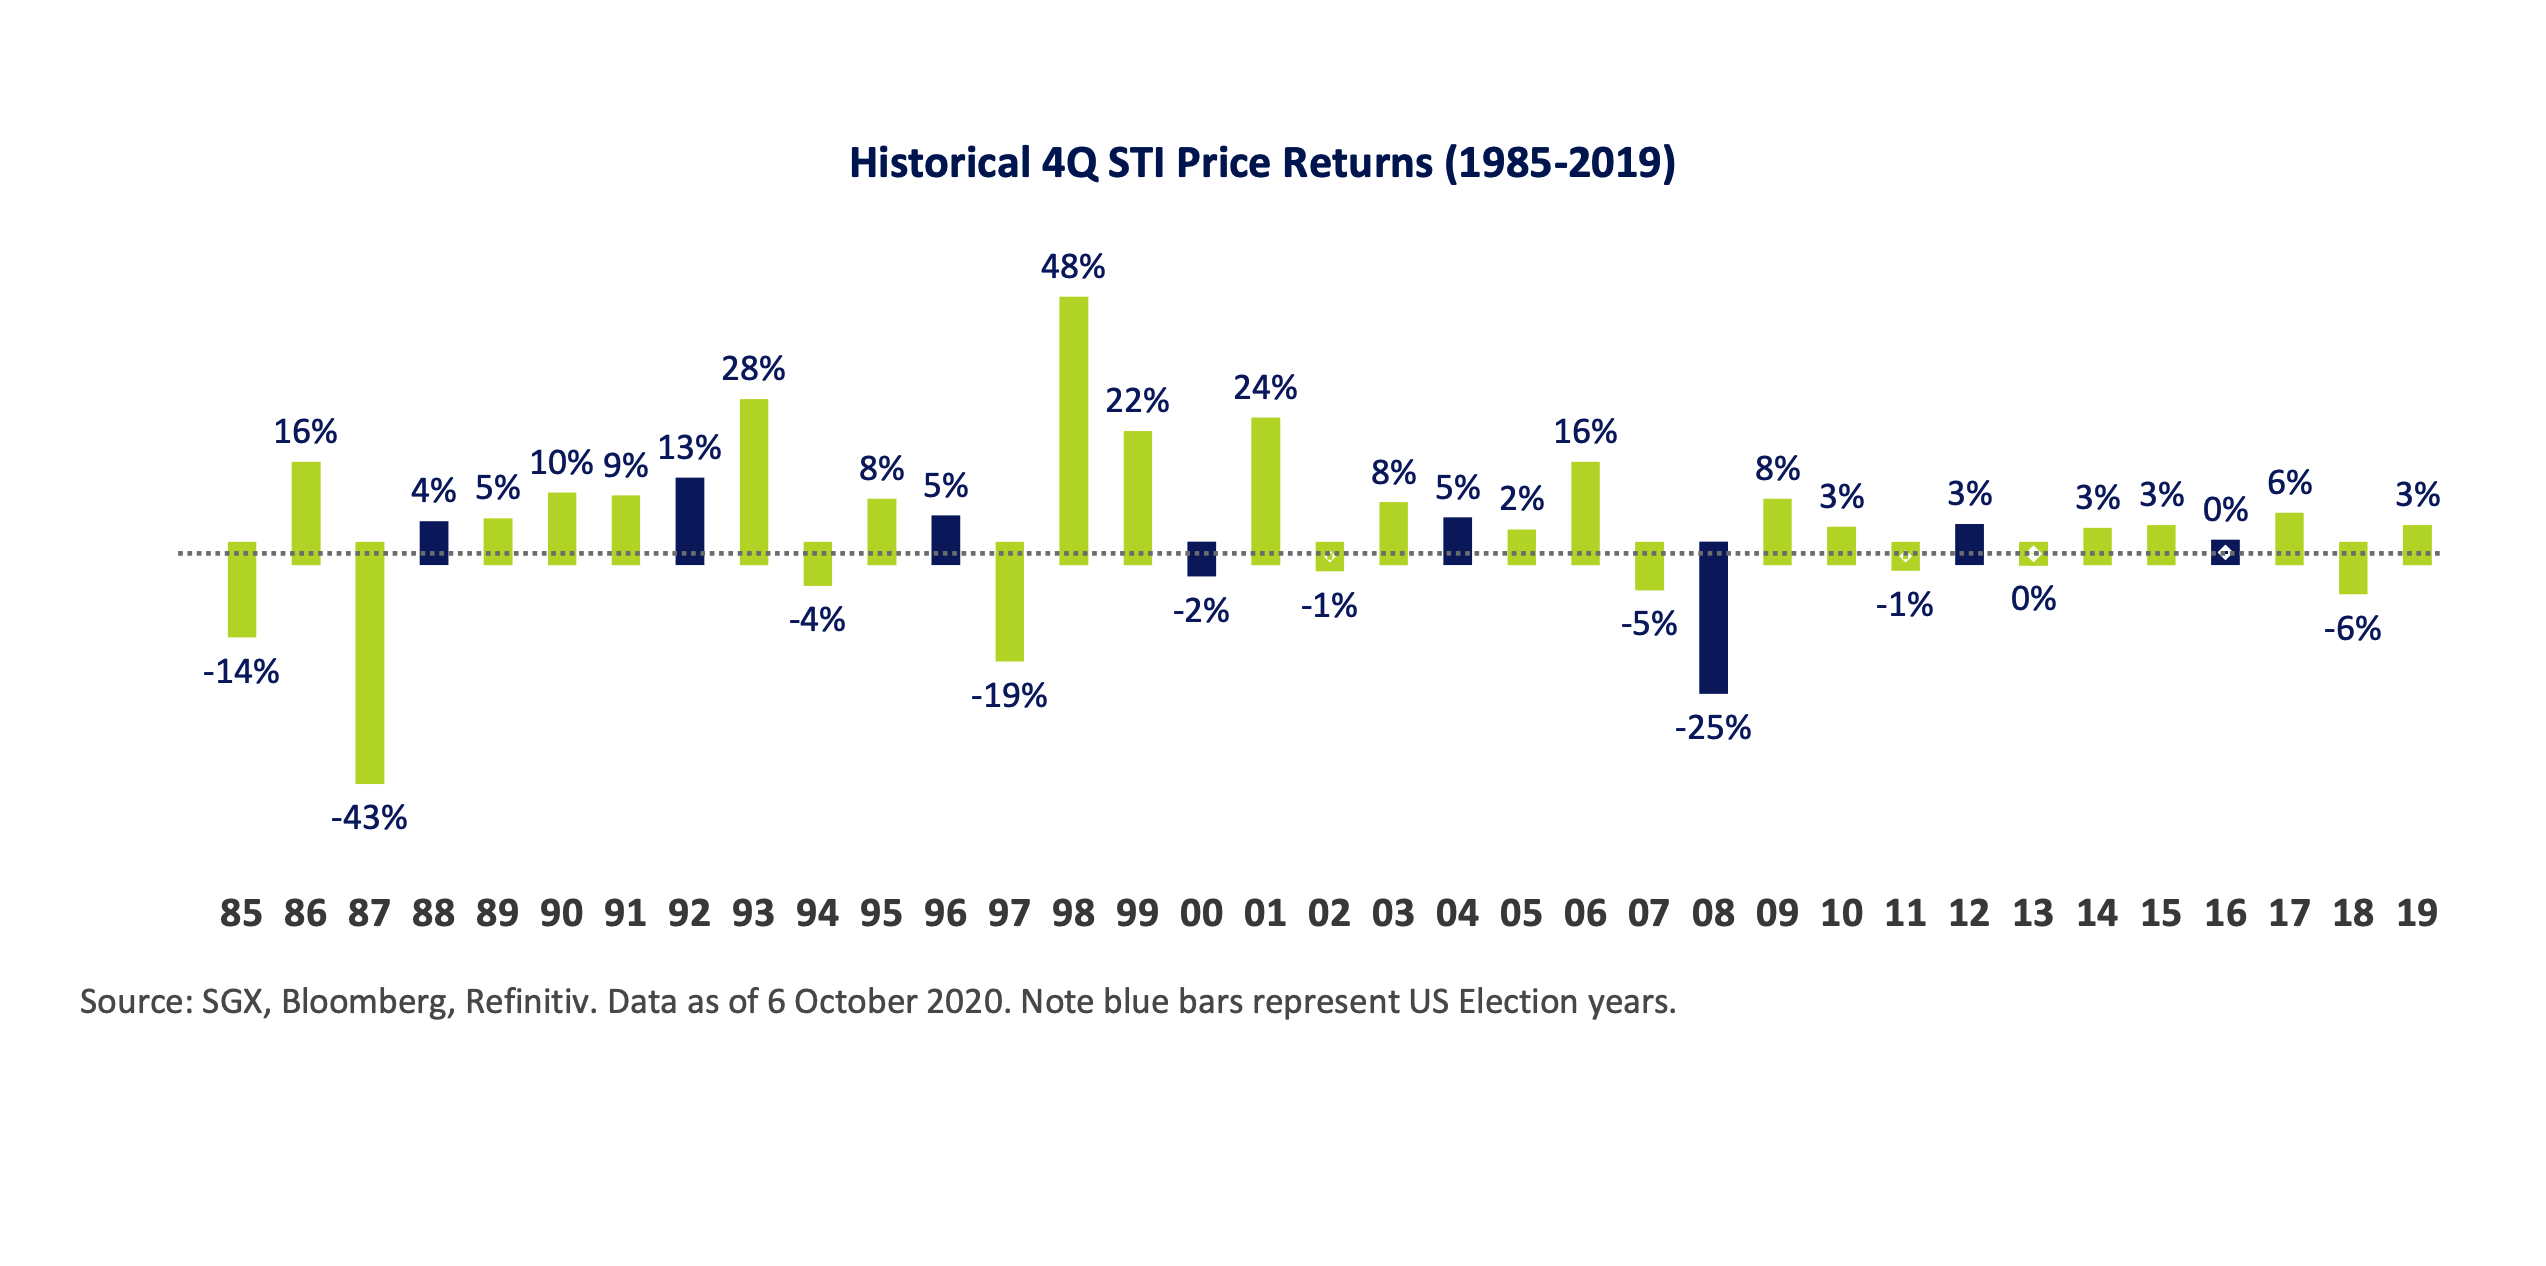
Since 1985, the STI has averaged a 3.8% gain in the fourth quarter of the Calendar Year, with the median total return of 4.0%. However, the constant caveat is that past performance doesn’t guarantee future results, and this is clearly relevant in these unprecented social and economic times.

Over the past 35 years, there were 24 years that the fourth quarter saw a positive return, with one quarter generating a flat return and 10 quarters of declines. For the eight US Presidential Elections that took place over the 35 years, the average gain was 0.4%, with the median gain at 3.8%.


4Q STI Price Returns (1985 - 2019)


2020 US Presidential Election 

While the quarterly returns during election years were mostly in-line with non-election years, investors will recall that the Asia trading session on 9 November 2016 saw a volatile session for the STI, which opened near highs at 2,838, formed a low at 2,760 and closed back up at 2,820. In the year 2000, when an immediate election result was too close to call, there were close to five weeks from the election date to when the US Supreme Court ordered an end to the Florida recount on 12 December. This resulted in former US Vice President Gore conceding defeat on 13 December. From 8 November through to 14 December, the STI was basically unchanged, moving from 2,042 to 2,038, however had closed as low as 1,954 on 22 November and as high as 2,070 on 13 December. 

History suggests that for the 2020 election, a return of US President Trump, with Democrats still controlling the House of Representatives would bring less market uncertainty and hence less market volatility. Less market votality may also prevail if former Vice-President Biden is elected President, with the Republican Party still controlling the Senate. 

Alternatively, markets would also be assured with less uncertainty if the Democrats control the Senate and the Republicans control the House. In essence, US markets face potentially less social and economic policy uncertainty when congress is split between the two major parties. A study by LPL Research and Bloomberg in 2018 showed that the S&P 500 had a history of better performances for the preceding 70 years when Congress was split between the Republicans and the Democrats. As noted by Eurasia Group, President Trump and former Vice President Biden remain locked in a competitive race for the presidency, with Biden still the favourite to win the election in early November (click here for more).

At the same time, the calls by the Fed Reserve, push by both parties and debate for further stimulus in the US is expected to continue, with Republicans calling for less than S$2 trillion in supportive measures and Democrats calling for more than S$2 trillion in stimulus. 


COVID-19 Vaccine by 4Q-end? 

The biggest driver of markets in 4Q20 will continue to be the social and economic impacts of containing COVID-19 in addition to vaccine developments. Over 3Q20, the global infections more than tripled to 33 million cases with more prevalent testing seeing the total mortality rate decline from 4.9% to 3.0%.

According to the World Health Organisation (“WHO”), there arre currently over 169 COVID-19 vaccine candidates under development, with 26 of these in the human trial phase. The WHO maintained that when a safe and effective vaccine is found, COVAX (led by WHO, Gavi, the Coalition for Epidemic Preparedness Innovations) will facilitate the equitable access and distribution of these vaccines to protect people in all countries. On a hopeful note, last night the WHO Director-General stated that a vaccine for COVID-19 may be ready by year-end. 


Medtecs International and SATS lead Most Actives in 4Q-to-Date 

Singapore’s 40 most traded stocks in the 2020 year to 6 October are tabled below, sort by avergae daily turnover and include 29 of the 30 STI stocks. The 2 strongest stocks of the 40 over the first four sessions of October with 10% returns include Medtecs International and SATS. Medtecs International Corp was one of the most positively impacted stocks this year, while SATS, was one of the more negatively impacted stocks by the measures imposed to contain the pandemic both in Singapore and abroad.


Stock SGX
Code
Market
Cap
(S$M)
1Q20
Price
Change
%
2Q20
Price
Change
%
3Q20
Price
Change
%
31Sep-06Oct
Total
Return
 %
YTD
Price
Change
%
YTD
Total
Return
 %
YTD
 Net Insti
Inflow
(S$M)
DBS GROUP HOLDINGS D05 52,585 -28 12 -4 4 -20 -17 -1,437
SINGTEL Z74 35,434 -25 -3 -14 2 -36 -34 -865
UNITED OVERSEAS BANK U11 32,604 -26 4 -6 3 -26 -22 -1,477
OVERSEA-CHINESE BANKING CORP O39 37,973 -21 4 -6 2 -21 -17 -920
ASCENDAS REIT A17U 11,730 -5 12 2 0 9 13 376
CAPITALAND MALL TRUST C38U 7,233 -27 9 -2 2 -20 -18 -151
WILMAR INTERNATIONAL F34 28,873 -22 27 8 3 10 14 77
SINGAPORE EXCHANGE S68 9,769 4 -9 10 1 3 6 192
MAPLETREE LOGISTICS TRUST M44U 7,889 -9 23 5 1 19 22 107
CAPITALAND C31 14,332 -24 2 -7 2 -26 -23 -130
SINGAPORE AIRLINES C6L 10,526 -37 -8 -7 2 -44 -44 -629
COMFORTDELGRO C52 3,120 -36 -5 -3 2 -39 -37 -336
MAPLETREE COMMERCIAL TRUST N2IU 6,562 -23 5 1 2 -17 -16 -47
CAPITALAND COMMERCIAL TRUST C61U 6,527 -23 10 -3 3 -15 -12 68
KEPPEL CORPORATION BN4 8,033 -22 13 -25 -1 -35 -33 -108
JARDINE MATHESON J36 42,608 -5 -18 -7 7 -23 -20 -31
VENTURE CORPORATION V03 5,762 -16 19 19 3 23 28 243
MAPLETREE INDUSTRIAL TRUST ME8U 7,709 -7 18 12 2 26 30 49
GENTING SINGAPORE G13 8,264 -25 10 -12 2 -26 -23 91
YANGZIJIANG SHIPBUILDING BS6 3,901 -26 12 6 1 -11 -7 -26
ST ENGINEERING S63 11,092 -21 6 5 3 -10 -5 71
SATS S58 3,471 -38 -9 -1 10 -39 -39 -242
AEM HOLDINGS AWX 994 -17 88 23 -6 79 83 54
CITY DEVELOPMENTS C09 7,010 -34 16 -10 2 -29 -28 -153
SUNTEC REIT T82U 4,147 -32 13 3 1 -20 -17 -48
MEDTECS INTERNATIONAL  546 654 135 337 184 10 3116 3146 3
THAI BEVERAGE  Y92 14,944 -32 12 -10 -2 -33 -31 -191
KEPPEL DC REIT AJBU 4,768 10 11 15 0 40 44 49
SINGAPORE PRESS HOLDINGS T39 1,654 -16 -31 -18 0 -52 -52 -161
HONGKONG LAND  H78 12,116 -31 8 -12 2 -33 -29 -126
SEMBCORP INDUSTRIES U96 2,376 -32 13 52 -1 15 18 -166
JARDINE CYCLE & CARRIAGE C07 7,154 -35 2 -11 1 -40 -37 -149
FRASERS LOGISTICS & COMMERCIAL TRUST BUOU 4,744 -29 34 17 0 12 16 75
JARDINE STRATEGIC  J37 31,711 -23 -5 -10 6 -31 -29 -32
NETLINK NBN TRUST CJLU 3,780 -4 7 1 -1 3 5 -27
UOL GROUP U14 5,712 -21 3 -2 2 -19 -17 23
MAPLETREE NORTH ASIA COMMERCE TRUST RW0U 3,049 -31 15 1 1 -19 -17 -44
RIVERSTONE HOLDINGS AP4 2,772 6 165 34 7 304 309 -12
KEPPEL REIT K71U 3,705 -23 16 -3 2 -12 -9 20
FRASERS CENTREPOINT TRUST J69U 2,668 -20 3 3 2 -15 -12 -22
Average     -17 21 6 2 74 77  
Median     -23 10 -1 2 -19 -17  

Source: SGX, Bloomberg and Refinitiv (Data as of 6 October)


Singapore’s largest and most traded stocks also have significant regional ties hence potential currency volatility will continue to drive corporate and market sentiment in 4Q20. Regional exposures are quantified regularly in Financial Statements with geographical segment reporting According to these statements and the most recent weightings - 50% of the revenue of the STI in its weighted form was reported to Singapore with 44% reported to Asia Pacific countries outside of Singapore. There is also 6% of the revenue attributed to United States, Europe and other jurisdictions.

STI stocks with the most exposure to Greater China include Dairy Farm International, Hongkong Land, Yangzijiang Shipbuilding Holdings, Wilmar International and CapitaLand. In addition, Singapore lists close to 150 stocks that report anything from 10% to 100% of their revenue to China, including as many as 10 REITs. Since 2010, DBS Group Holdings, Oversea-Chinese Banking Corp and United Overseas Bank have increased their combined annual income that is segmented to Greater China by 175%. The combined Greater China income of the three banks grew from S$2.33 billion in 2010, to S$6.42 billion in 2019.

In the 2020 year-to-date China small-cap Indices have outpaced its large-cap Indices, with the Smaller Cap stocks  generating more than double the price returns of the former. In August, the price-ratio spread of the FTSE China A Small-Cap Index to the FTSE China A50 Index reached a 16-month high. China Industrial production for the first eight months of 2020 grew 0.4% from the same period in 2019 and current consensus estimates are for 5% y-o-y growth in 3Q20, which will be released on 19 October. 


Upcoming Event on 12 October – Recovering from COVID-19: A Global Perspective on the Challenges Ahead

SGX will be hosting an upcoming live webinar with Eurasia Group (12 Oct, 7pm SGT) – one of the world’s leading global political risk research and consulting firm. This will be the first of a series of webinars and monthly content as part of our partnership with Eurasia. To join the event click here.


This article is provided by SGX My Gateway.


SGX My Gateway

SGX's investor education portal with market, product and investment information and events. Sign up now at sgx.com/mygateway to receive our investment updates and economic calendar.

This document is not intended for distribution to, or for use by or to be acted on by any person or entity located in any jurisdiction where such distribution, use or action would be contrary to applicable laws or regulations or would subject Singapore Exchange Limited (“SGX”) to any registration or licensing requirement. This document is not an offer or solicitation to buy or sell, nor financial advice or recommendation for any investment product. This document is for general circulation only. It does not address the specific investment objectives, financial situation or particular needs of any person. Advice should be sought from a financial adviser regarding the suitability of any investment product before investing or adopting any investment strategies. Use of and/or reliance on this document is entirely at the reader’s own risk. Further information on this investment product may be obtained from www.sgx.com. Investment products are subject to significant investment risks, including the possible loss of the principal amount invested. Past performance of investment products is not indicative of their future performance. Examples provided are for illustrative purposes only. While each of SGX and its affiliates (collectively, the SGX Group Companies) have taken reasonable care to ensure the accuracy and completeness of the information provided, each of the SGX Group Companies disclaims any and all guarantees, representations and warranties, expressed or implied, in relation to this document and shall not be responsible or liable (whether under contract, tort (including negligence) or otherwise) for any loss or damage of any kind (whether direct, indirect or consequential losses or other economic loss of any kind, including without limitation loss of profit, loss of reputation and loss of opportunity) suffered or incurred by any person due to any omission, error, inaccuracy, incompleteness, or otherwise, any reliance on such information, or arising from and/or in connection with this document. The information in this document may have been obtained via third party sources and which have not been independently verified by any SGX Group Company. No SGX Group Company endorses or shall be liable for the content of information provided by third parties. The SGX Group Companies may deal in investment products in the usual course of their business, and may be on the opposite side of any trades. SGX is an exempt financial adviser under the Financial Advisers Act (Cap. 110) of Singapore. The information in this document is subject to change without notice. This document shall not be reproduced, republished, uploaded, linked, posted, transmitted, adapted, copied, translated, modified, edited or otherwise displayed or distributed in any manner without SGX’s prior written consent.


SGX Stock / REIT Search

Advertisement

Trust Bank Referral Code

Advertisement