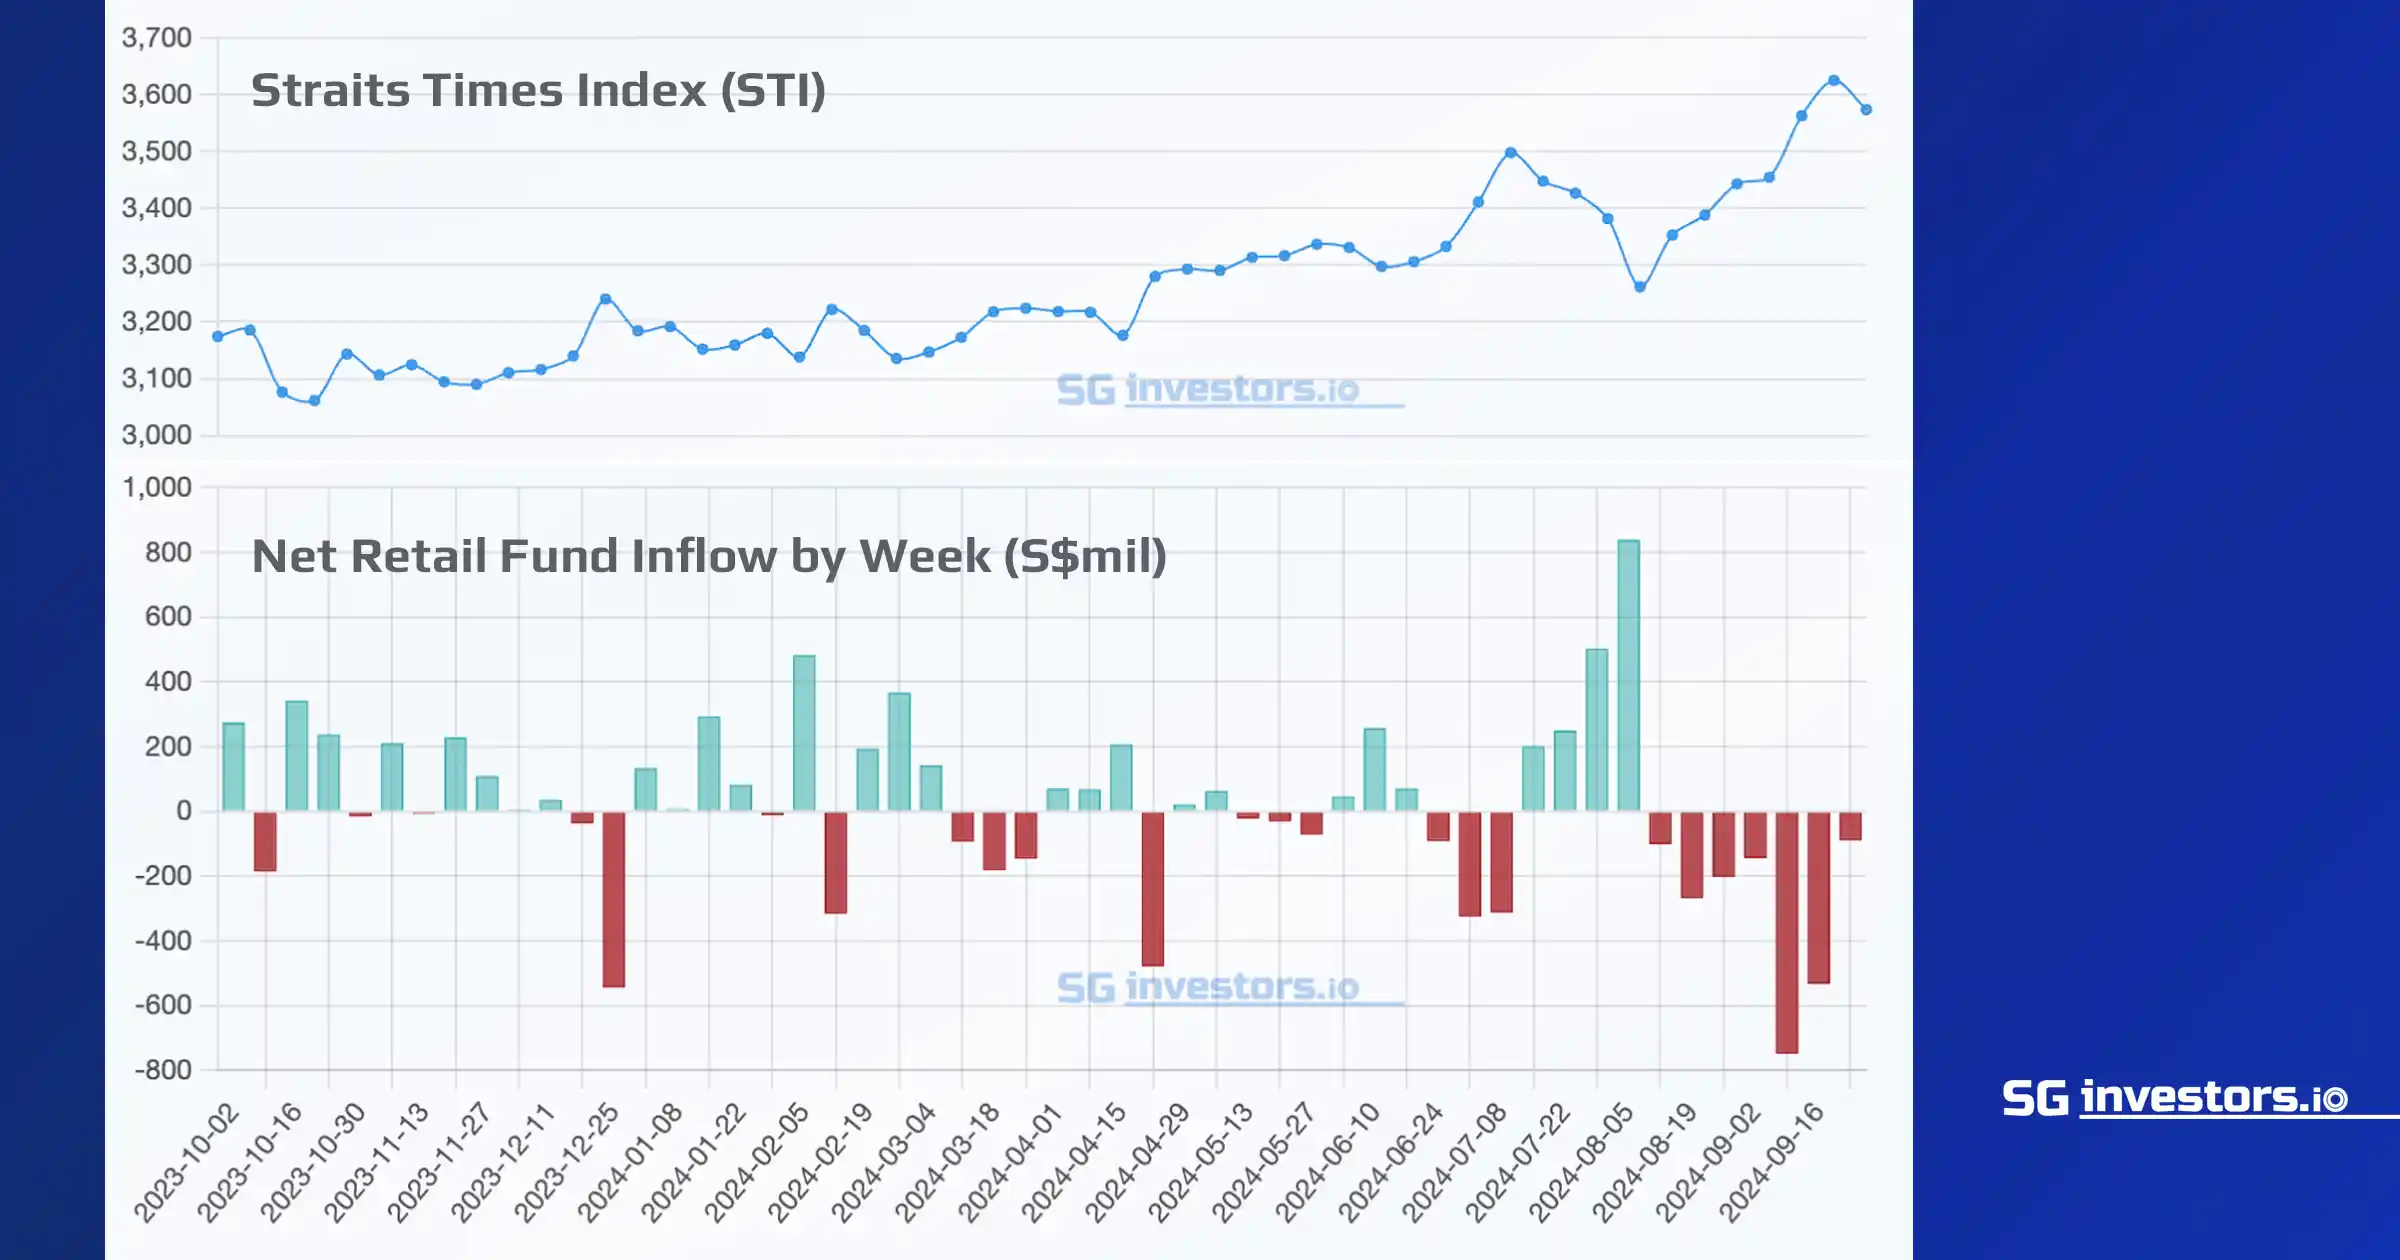
In 3Q24, retail investors net sold S$955 million worth of Singapore-listed stocks, with the bulk of the net outflow booked in September. The STI generated an 10% total return in 3Q24, with the iEdge SG Manufacturing Index and iEdge S-REIT Index in tandem generating respective total returns at 14% and 17%.
The 10 Singapore stocks that booked the most net retail outflow in 3Q24, averaged 17% gains for the quarter, bringing their average nine month total returns to 19%. Meanwhile, the 10 stocks that booked the most net retail inflow in September averaged just 2% gains for 3Q24, in addition to 2% total returns for the nine months.
The 5 stocks most net sold by retailers in 3Q24 included Singtel (-S$616m), SGX (-S$256m), SATS (-S$122m), UOB (-S$117m) and Suntec REIT (-S$82m), while the 5 stocks most net bought by retailers in 3Q24 included Yangzijiang Shipbuilding (+S$243m), SIA (+S$228m), Keppel (+$S113m), Genting Singapore (+S$64m) and UMS (+S$34m).
Retail investors net sold S$955 million of Singapore-listed stocks in 3Q24, while ASEAN benchmarks outpaced regional peers on the back of 2Q24 growth prints and currency appreciations. The local net retail selling was comprised of net retail outflow of S$19 million in July, a contrasting S$603 million of net retail inflow in August, then as much as S$1.5 billion of net outflow in September. This brought the net retail inflow to the local stock market for the first nine months of 2024 to S$121 million. The STI also reached new 17 years highs in September, with the post 2007 high now at 3,652.62.
During 3Q24, the STI generated a 9.9% total return, bringing its 9-month total return to 16.1%. This compared to 3Q24 and 9-month total returns of 11.9% and 13.5% for the FTSE ASEAN All-Share Index, 5.0% and 17.0% for the FTSE APAC Ex-Japan Index and 4.0% and 15.3% for the FTSE Asia Pacific Index.
The 10 local stocks that booked the most net retail outflow in 3Q24 are tabled below.
SG Stocks with Most Net Retail Outflow in 3Q24 | SGX Code |
Market Cap S$m |
Sep24 Price Change % |
Sep24 Net Retail Inflow S$m |
3Q24 Net Retail Inflow S$m |
3Q24 Total Return % |
YTD Total Return % |
YTD Average Daily Turnover S$m |
YTD Net Institutional Inflow S$m |
YTD Net Retail Inflow S$m |
---|---|---|---|---|---|---|---|---|---|---|
SingTel | Z74 | 53,503 | 4 | -166 | -616 | 21 | 35 | 97 | 859 | -870 |
SGX | S68 | 12,229 | 5 | -73 | -256 | 20 | 18 | 20 | 205 | -221 |
SATS | S58 | 5,386 | -1 | 12 | -122 | 27 | 32 | 15 | 139 | -140 |
UOB | U11 | 53,799 | 2 | -177 | -117 | 6 | 20 | 85 | 542 | -542 |
Suntec REIT | T82U | 3,875 | 8 | -32 | -82 | 28 | 13 | 10 | 70 | -60 |
OCBC | O39 | 67,964 | 4 | -226 | -71 | 8 | 24 | 79 | 281 | -336 |
ST Engineering | S63 | 14,528 | 5 | -11 | -68 | 9 | 23 | 18 | 194 | -211 |
Sembcorp | U96 | 9,884 | 12 | -83 | -67 | 17 | 7 | 18 | 54 | -30 |
ComfortDelGro | C52 | 3,271 | 6 | -34 | -58 | 16 | 13 | 9 | 108 | -101 |
CapitaLand Investment | 9CI | 15,565 | 15 | -64 | -57 | 17 | 3 | 28 | -78 | 109 |
Total | 240,004 | -854 | -1,514 | 379 | 2,373 | -2,400 | ||||
Average | 6 | 17 | 19 |
In the table above, SATS' net retail inflow was highest when proportioning the net outflow (S$122 million) to quarter end market capitalisation (S$5.4 billion) at 2.3%. SATS also generated a 27% total return in 3Q24 contributing the bulk of its nine month gains.
Refer to SATS' earnings announcement dated 20 Aug, the company highlighted a strong start to its FY25, with a 1QFY25 PATMI of S$65.0 million, a turnaround of the S$29.9 million loss in 1QFY24, primarily due to increased business volumes, which provided scale leverage, and follow the completion of the WFS acquisition.
The 10 SGX listed stocks that booked the most net retail inflow in 3Q24 are tabled below. By contrast these 10 stocks averaged 2% total returns in 3Q24, as compared to the 10 stocks in the above table that averaged 17% returns for the quarter.
SG Stocks with Most Net Retail Inflow in 3Q24 | SGX Code |
Market Cap S$m |
Sep24 Price Change % |
Sep24 Net Retail Inflow S$m |
3Q24 Net Retail Inflow S$m |
3Q24 Total Return % |
YTD Total Return % |
YTD Average Daily Turnover S$m |
YTD Net Institutional Inflow S$m |
YTD Net Retail Inflow S$m |
---|---|---|---|---|---|---|---|---|---|---|
Yangzijiang | BS6 | 9,679 | -2 | 85 | 242.9 | 0 | 71 | 46 | 2 | -79 |
SIA | C6L | 20,218 | 8 | -116 | 227.5 | 5 | 10 | 38 | -497 | 500 |
Keppel | BN4 | 11,974 | 7 | -30 | 113.1 | 5 | -1 | 25 | -28 | 117 |
Genting Singapore | G13 | 10,563 | 9 | -38 | 63.8 | 4 | -8 | 26 | -169 | 173 |
UMS | 558 | 760 | 5 | 11 | 34.1 | -8 | -18 | 5 | -50 | 64 |
Frencken | E28 | 585 | 7 | 3 | 30.3 | -16 | 3 | 6 | -4 | 12 |
Raffles Medical | BSL | 1,707 | 2 | 8 | 25.1 | -8 | -13 | 2 | -74 | 76 |
City Developments | C09 | 4,824 | 3 | 15 | 24.4 | 5 | -17 | 17 | -248 | 251 |
CapitaLand Ascott Trust | HMN | 3,692 | 7 | -1 | 22.2 | 15 | 5 | 5 | -74 | 70 |
Mapletree Logistics Trust | M44U | 7,323 | 7 | 5 | 21.2 | 15 | -12 | 33 | -242 | 254 |
Total | 71,327 | -58 | 805 | 205 | -1,385 | 1,438 | ||||
Average | 5 | 2 | 2 |
Next 15 SG Stocks with Most Net Retail Outflow in 3Q24 | SGX Code |
Market Cap S$m |
Sep24 Price Change % |
Sep24 Net Retail Inflow S$m |
3Q24 Net Retail Inflow S$m |
3Q24 Total Return % |
YTD Total Return % |
YTD Average Daily Turnover S$m |
YTD Net Institutional Inflow S$m |
YTD Net Retail Inflow S$m |
---|---|---|---|---|---|---|---|---|---|---|
AEM | AWX | 441 | 11 | 6 | 19 | -21.7 | -59 | 5 | -98 | 100 |
Keppel Infra Trust | A7RU | 2,616 | 1 | 2 | 16 | 4.7 | 0 | 3 | -25 | 33 |
Golden Agri-Resources | E5H | 3,551 | 6 | 1 | 15 | 3.7 | 10 | 4 | -51 | 61 |
SingPost | S08 | 1,046 | 8 | 1 | 14 | 9.5 | -1 | 2 | 5 | 14 |
Riverstone | AP4 | 1,312 | -1 | 4 | 13 | -7.6 | 35 | 3 | 6 | -9 |
Mapletree Pan Asia Commercial Trust | N2IU | 7,780 | 8 | 2 | 13 | 23.4 | -1 | 23 | -89 | 135 |
CDL Hospitality Trusts | J85 | 1,278 | 9 | -1 | 11 | 10.4 | -2 | 2 | -27 | 26 |
Frasers Centrepoint Trust | J69U | 4,163 | -3 | 20 | 9 | 8.0 | 5 | 8 | -24 | 31 |
Sasseur REIT | CRPU | 897 | 4 | 4 | 8 | 11.7 | 12 | 1 | -10 | 10 |
Marco Polo Marine | 5LY | 206 | 12 | 0 | 7 | -1.8 | 10 | 1 | 2 | -3 |
Geo Energy | RE4 | 378 | 4 | 2 | 6 | -6.2 | -20 | 3 | 2 | 0 |
Samudera Shipping | S56 | 439 | 3 | -1 | 6 | -21.4 | 40 | 3 | 9 | -8 |
CapitaLand China Trust | AU8U | 1,457 | 23 | -4 | 6 | 33.7 | 0 | 2 | -49 | 52 |
Olam | VC2 | 4,248 | -1 | 1 | 5 | 0.0 | 14 | 2 | -2 | 3 |
Mapletree Industrial Trust | ME8U | 6,890 | 0 | 8 | 5 | 16.9 | 1 | 14 | -87 | 63 |
Total | 36,704 | 46 | 154 | 74 | -440 | 508 | ||||
Average | 5 | 4 | 3 |