SGX Market Updates

Straits Times Index's July Journey: Inflows, Outflows, and Resilience


PUBLISHED ON |

01 August 2024

  • The STI added 3.7% in July, bringing the 7-month total return to 9.6%. While the STI Banks (DBS, OCBC & UOB) averaged 2.8% gains for the month, both the iEdge S-REIT Index and iEdge SG Manufacturing Index generated 5.5% total returns. The FTSE APAC Index gained 1.2% for the month, in S$ terms.

  • Singapore stocks booked S$198 million of net institutional inflow on the month, reversing more than 15% of the net outflow in 1H24. In July, the trio of STI Banks saw S$38 million of net inflow, the iEdge S-REIT Index saw S$19 million of net outflow, and the iEdge SG Manufacturing Index saw S$76 million of net inflow.

  • The STI ended July with its P/B ratio at 0.3 standard deviations (s.d.) above the 5-year historical mean. By comparison, the iEdge SG Manufacturing Index P/B ratio ended at 0.4 s.d. above its mean and the iEdge S-REIT Index ended the month at 1.2 s.d. below its mean.


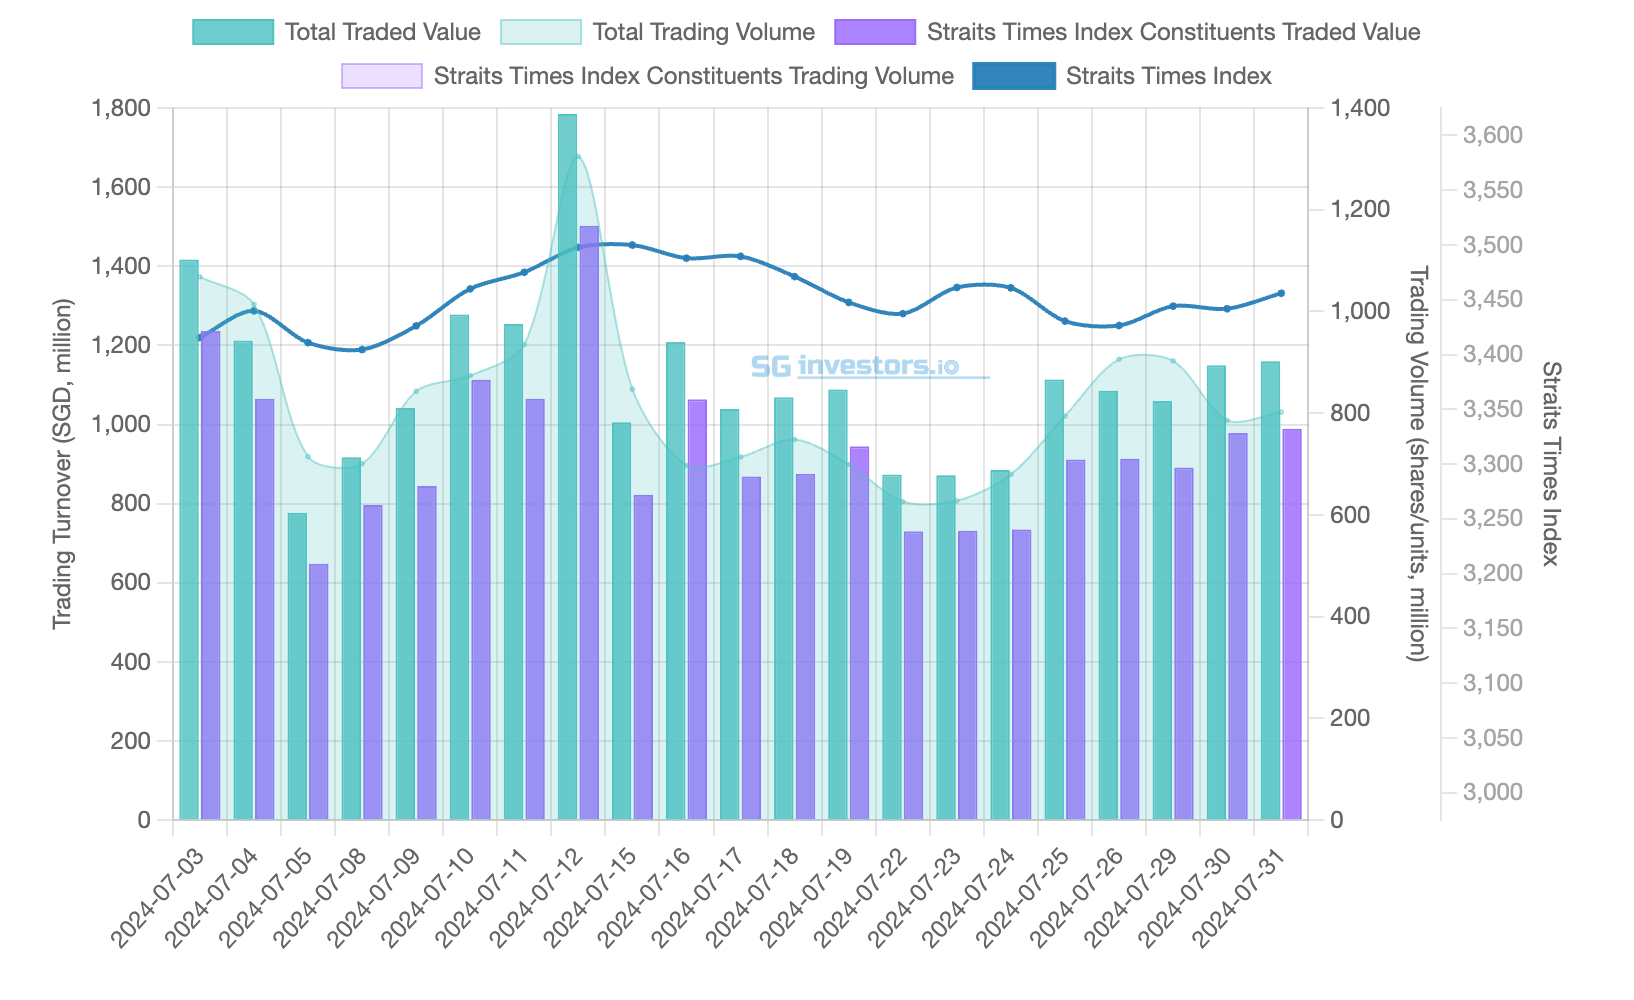
The Straits Times Index (STI) added 3.7% in July, ending the month at 3,455.94, with the FTSE Asia Pacific Index gaining 1.2% in S$ terms. This brings the STI total return for the first seven months to 9.6%, with the two STI-tracking ETFs averaging 9.2% total returns. These two ETFs also saw the net inflows of 1H24 reversed with net outflows in July, coinciding with the STI posting the highest monthly percentage price gain since December 2023.

The trio of STI Banks averaged 2.8% gains in July, and saw their combined STI weight marginally decrease from 51.5% to 50.9%. At the same time the iEdge S-REIT Index and iEdge SG Manufacturing Index both generated 5.5% total returns over the month. Together the trio of STI Banks booked S$38 million of the net institutional inflow in July, taking their combined net institutional inflow for the past seven months to S$632 million.

In July, the iEdge SG Manufacturing Index recorded net institutional inflow of S$76 million, with contributions led by SATS (SGX:S58), ST Engineering (SGX:S63) and Venture Corp (SGX:V03). Notably, SATS (SGX:S58) was also among the top performers in the STI for the month, alongside Seatrium (SGX:5E2) and Thai Beverage (SGX:Y92). SATS's expansion through the integration of Worldwide Flight Services has extended its global footprint to over 215 locations across more than 27 countries. Separately, a July IMF working paper underscored the importance of horizontal integration in lessening the adverse effects of uncertainty on global trade. This highlights a broader context and key economic theme going into 2025 where strategic horizontal expansions can potentially bolster operational resilience.

Meanwhile the constituents of the iEdge S-REIT Index booked S$19 million of net institutional outflow in July. This was a significantly slower outflow pace than seen in 1H24, with the constituents booking S$1.1 billion of net institutional outflow. Suntec REIT (SGX:T82U) ranked among the stocks with the highest net institutional inflow in July (+S$24.5 million), reversing the S$22.2 million net institutional outflow in 1H24.

The 20 stocks that booked the highest net institutional inflow in July are tabled below.


20 Singapore stocks that booked the highest net institutional inflow in July 2024

Stock SGX
Code
Market
Cap
S$m
July
Price Change
%
July
Net Institutional Inflow
S$M
YTD
Total Return
%
YTD
Net Institutional Inflow
S$M
2023
Total Return
%
Indicative Dividend Yield
%
P/B
(x)
5-Year
Average P/B
(x)
SingTel Z74 50,861 12.0 293.7 24.7 510.4 1.4 4.3 2.0 1.5
UOB U11 54,133 3.3 100.7 16.9 499.3 -2.1 5.3 1.2 1.1
SATS S58 4,903 15.1 54.2 19.8 88.1 2.4 0.5 2.1 2.4
ARA US Hospitality Trust XZL 234 5.7 45.3 6.8 43.9 -6.5 11.4 0.4 0.6
OCBC O39 66,745 2.9 36.8 17.7 260.1 13.7 5.5 1.2 1.0
SGX S68 10,526 3.9 35.4 2.1 -17.0 13.7 3.5 6.2 7.5
ST Engineering S63 13,785 2.1 33.0 15.9 154.5 21.2 3.6 5.6 5.1
Venture Corp V03 4,384 6.3 28.2 15.2 93.1 -16.2 5.0 1.5 1.8
Suntec REIT T82U 3,438 12.4 24.5 -1.2 2.2 -5.7 5.7 0.5 0.7
Seatrium 5E2 5,723 21.7 23.3 -28.8 -247.0 -14.5 N/A 0.9 0.8
Mapletree Pan Asia Commercial Trust N2IU 6,729 4.9 22.6 -15.7 -159.2 -0.5 7.0 0.7 1.1
Thai Beverage Y92 12,689 12.2 17.8 0.5 54.3 -20.6 4.4 1.7 2.6
Great Eastern G07 12,212 0.5 17.0 49.8 55.1 0.1 3.3 1.5 1.1
Keppel DC REIT AJBU 3,481 12.2 11.6 6.3 -38.6 15.6 4.4 1.5 1.8
ComfortDelGro C52 3,033 4.5 9.3 2.6 62.4 20.6 4.8 1.2 1.3
CapitaLand Integrated Commercial Trust C38U 14,008 5.1 8.1 3.9 -32.0 6.5 5.2 1.0 1.0
Dyna-Mac NO4 596 37.3 8.0 73.7 26.2 80.2 1.5 8.5 4.3
CSE Global 544 329 18.7 6.7 14.5 -1.8 35.6 5.8 1.4 1.3
Golden Agri-Resources E5H 3,487 1.9 6.0 8.2 -29.0 7.9 2.2 0.5 0.5
Yoma Strategic Z59 274 -0.8 3.6 69.4 4.8 -38.5 N/A 0.6 0.5

All Data as of 31 July 2024.
Source: SGX, Refinitiv.
Note: ARA US Hospitality Trust net institutional inflow coincided with Acrophyte Pte Ltd acquisition.


The five stocks that saw the highest net institutional outflow in July averaged 0.3% declines over the month and included:


The first half of July was comparatively more bullish for the local market with S$418 million of net institutional inflow and the STI forming its six year high at 3,509.20 on 15 July. This was primarily on the increased likelihood of a smooth recovery in the US economy. However, the familiar theme of geopolitical uncertainty took hold in the second half of the month, which saw the STI give back one quarter of the 5.0% gain it had built in the first half of July. The latter half of the month also saw S$220 million of overall net institutional outflow in the local market.

Global monetary policy was firmly in focus in July.

  • Over the course of July, expectations for an 18 September FOMC Federal Funds Rate cut increased from 65% to 100%, with the expectation for at least 100bps in cuts by the conclusion of March 2025 meeting to near 90%, versus 33% at the end of June.

  • In China, the PBOC cut its new key policy rate, the 7-day reverse repo, to 1.75%, after outlining five monetary policy reforms to enhance economic recovery and development back in June. Meanwhile, the FTSE China A50 Index saw a slight decline but yielded a positive total return due to dividends, with shifts towards China Government Bonds amid the policy changes.

  • The BOJ also raised its benchmark interest rate to 0.25% on July 31 and signaled a tapering of its bond-buying program, while maintaining a supportive stance for the economy with negative real interest rates. The decision bolstered the Japanese Yen (JPY) throughout July, so that the 0.6% TOPIX decline in JPY terms, translated to a 6.3% US$ return for the Index. This also saw the Lion-Nomura Japan Active ETF gain 5% for the US$ counter, and 4% for the S$ counter.


The STI ended July with its P/B ratio at 1.14x, which was 0.3 standard deviations (s.d.) above the five-year historical mean of 1.11x. By comparison when the STI made a high of 3,641.65 in early May 2018, the P/B was at 1.37x which at the time was also 0.3 s.d. above the 5-year mean of 1.32x. The FTSE Asia Pacific Ex-Japan Index ended July with a P/B of 1.70x that was similarly 0.2 s.d. above its 5-year historical mean.

By comparison, the iEdge SG Manufacturing Index P/B ended at 0.4 s.d. above its 5-year mean and the iEdge S-REIT Index ended the month at 1.2 s.d. below its 5-year mean.

After the 31 July close, the IMF released the Annual Article IV Country Report on Singapore, highlighting that Singapore's economic growth is on a recovery path, bolstered by external demand, with reduced growth risks and gradual disinflation despite potential inflationary pressures from labor and commodity markets.


This article is provided by SGX My Gateway.


SGX My Gateway

SGX's investor education portal with market, product and investment information and events. Sign up now at sgx.com/mygateway to receive our investment updates and economic calendar.

This document is not intended for distribution to, or for use by or to be acted on by any person or entity located in any jurisdiction where such distribution, use or action would be contrary to applicable laws or regulations or would subject Singapore Exchange Limited (“SGX”) to any registration or licensing requirement. This document is not an offer or solicitation to buy or sell, nor financial advice or recommendation for any investment product. This document is for general circulation only. It does not address the specific investment objectives, financial situation or particular needs of any person. Advice should be sought from a financial adviser regarding the suitability of any investment product before investing or adopting any investment strategies. Use of and/or reliance on this document is entirely at the reader’s own risk. Further information on this investment product may be obtained from www.sgx.com. Investment products are subject to significant investment risks, including the possible loss of the principal amount invested. Past performance of investment products is not indicative of their future performance. Examples provided are for illustrative purposes only. While each of SGX and its affiliates (collectively, the SGX Group Companies) have taken reasonable care to ensure the accuracy and completeness of the information provided, each of the SGX Group Companies disclaims any and all guarantees, representations and warranties, expressed or implied, in relation to this document and shall not be responsible or liable (whether under contract, tort (including negligence) or otherwise) for any loss or damage of any kind (whether direct, indirect or consequential losses or other economic loss of any kind, including without limitation loss of profit, loss of reputation and loss of opportunity) suffered or incurred by any person due to any omission, error, inaccuracy, incompleteness, or otherwise, any reliance on such information, or arising from and/or in connection with this document. The information in this document may have been obtained via third party sources and which have not been independently verified by any SGX Group Company. No SGX Group Company endorses or shall be liable for the content of information provided by third parties. The SGX Group Companies may deal in investment products in the usual course of their business, and may be on the opposite side of any trades. SGX is an exempt financial adviser under the Financial Advisers Act (Cap. 110) of Singapore. The information in this document is subject to change without notice. This document shall not be reproduced, republished, uploaded, linked, posted, transmitted, adapted, copied, translated, modified, edited or otherwise displayed or distributed in any manner without SGX’s prior written consent.


SGX Stock / REIT Search

Advertisement

Trust Bank Referral Code

Advertisement