From the 21 Oct to 21 Nov close, the STI rallied 9.4%, with Singapore’s 100 most traded stocks in 2022-to-date averaging 8.0% total returns. These 100 stocks also saw S$730 million of combined net institutional fund inflows over the month, taking their 2022-to-date net institutional fund inflows to S$1.2 billion.
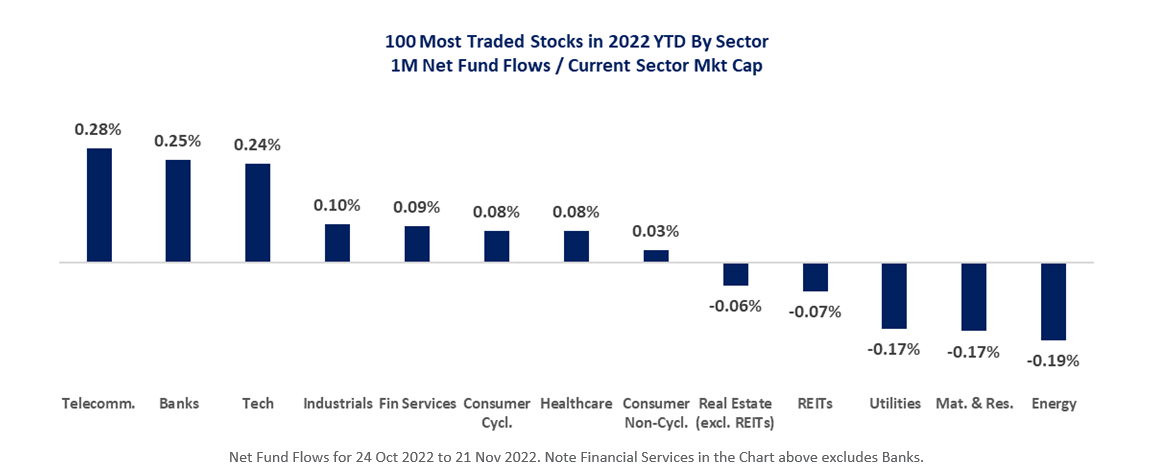
These 100 stocks represent all key sectors, with Telecommunications, Banks, and Technology Sectors seeing the most net institutional fund inflows, proportionate to their current market capitalisation over the month, while the Energy, Materials & Resources, and Utilities Sectors saw the most proportionate net institutional fund outflows.
Among these 100 stocks, the 10 stocks that saw the most net institutional fund inflows proportionate to their current market capitalisation, included 4 Technology stocks – Frencken, UMS, iFAST and Venture Corp, in addition to Sembcorp Marine, CDL Hospitality Trusts, UOB, Acesian Partners, Genting Singapore, and Yangzijiang Shipbuilding.
The past one month has seen the STI gain 9.4% from the 21 Oct session that preceded the Deepavali holiday through the 21 Nov close of 3,250.62. This momentum saw the STI retest the 3,300 level on 17-18 November, a key level last tested on 13 September and 11 August.
During the one month of trading activity, Singapore’s 100 most traded stocks saw S$730 million of net institutional fund inflows. Note these are the 100 most traded stocks for the 2022-to-date (21 Nov). The past month saw a marginally less hawkish outlook for US interest rates build, which brought the 10-year U.S. Treasury yields to 3.8% levels, down from above 4.2%, while the US Dollar Index also declined from above 113 to 107. At the same time, the outlook for China growth was helped with a slew of policy moves including optimised COVID-19 rules to bolster the economy, fiscal support to small businesses, in addition to a series of supportive property market policies reportedly introduced, that includes 16 measures co-released by the People's Bank of China (PBC) and the China Banking and Insurance Regulatory Commission (CBIRC).
This saw the Telecommunications, Banks, and Technology Sectors book the highest net institutional fund inflows, proportionate to their respective current market capitalisation over the month. The Telecommunications Sector net institutional inflows were driven by SingTel (SGX:Z74) which saw S$154 million net institutional fund inflows over the month, bringing its 2022 to 21 Nov net institutional fund inflows to S$942 million. The 3 banks – DBS (SGX:D05) OCBC (SGX:O39) and UOB (SGX:U11) together saw S$502 million of net fund inflows for the month, which represents 0.25% of their combined current market capitalisation of S$197 billion.
Meanwhile the Energy, Materials & Resources, and Utilities Sectors saw the most proportionate net institutional fund outflows.
Among these 100 stocks, the 10 stocks that saw the most net institutional fund inflows proportionate to their current market capitalisation, included four Technology stocks – Frencken (SGX:E28), UMS (SGX:558), iFAST (SGX:AIY) and Venture Corp (SGX:V03), in addition to Sembcorp Marine (SGX:S51), CDL Hospitality Trusts (SGX:J85), UOB (SGX:U11), Genting Singapore (SGX:G13), Yangzijiang Shipbuilding (SGX:BS6), and Catalist-listed Acesian Partners (SGX:5FW).
Five of these stocks were among the strongest performers of the 100 stocks over the past month. These were
- Frencken (SGX:E28),
- UMS (SGX:558),
- CDL Hospitality Trusts (SGX:J85),
- iFAST (SGX:AIY), and
- Acesian Partners (SGX:5FW).
The five other stocks that led the one-month performances of the broader group of 100 stocks included
- Top Glove (SGX:BVA),
- MarcoPolo Marine (SGX:5LY),
- Daiwa House Logistics Trust (SGX:DHLU),
- Yoma Strategic (SGX:Z59) and
- Wilmar International (SGX:F34).
Meanwhile, The Place Holdings (SGX:E27), NanoFilm Technologies (SGX:MZH), Golden Energy & Resources (SGX:AUE), Hongkong Land (SGX:H78) and Geo Energy Resources (SGX:RE4) led the decliners for the month, with NanoFilm Technologies, The Place Holdings also Golden Energy & Resources also booked the highest net fund outflows proportionate to their respective current market capitalisation for the month, along with SATS (SGX:S58) and ComfortDelGro (SGX:C52).
The list of SGX top 100 traded stocks in 2022-to-date sorted by highest net institutional fund inflows proportionate to their respective current market capitalisation are tabled below.
SGX Listed Top 100 Most Traded Stocks In 2022-To-Date |
SGX Code |
Market Cap S$M |
Average Daily Turnover S$M |
YTD Total Return % |
YTD Net Institutional Fund Flows S$M |
1-Month Total Return % |
1-Month Net Institutional Fund Flows S$M |
1-Month Net Institutional Fund Flows / Market Cap |
Sector |
---|---|---|---|---|---|---|---|---|---|
Frencken | E28 | 448 | 5.1 | -45 | -47.89 | 35 | 9.77 | 2.18% | Technology |
Sembcorp Marine | S51 | 4,112 | 14.9 | 60 | 199.49 | 10 | 68.12 | 1.66% | Industrials |
UMS | 558 | 823 | 7.3 | -16 | -16.96 | 42 | 6.87 | 0.83% | Technology |
CDL Hospitality Trusts | J85 | 1,546 | 2.9 | 11 | 9.50 | 23 | 9.47 | 0.61% | REITs |
UOB | U11 | 50,289 | 90.9 | 16 | -96.29 | 16 | 307.65 | 0.61% | Banks |
IFAST | AIY | 1,374 | 3.0 | -44 | -60.95 | 32 | 7.13 | 0.52% | Technology |
Acesian Partners * | 5FW | 21 | 0.7 | 162 | 0.66 | 17 | 0.11 | 0.51% | Industrials |
Genting Singapore | G13 | 10,503 | 16.2 | 15 | 156.96 | 12 | 52.94 | 0.50% | Consumer Cyclicals |
Venture Corp | V03 | 5,103 | 15.8 | 0 | -54.65 | 11 | 19.18 | 0.38% | Technology |
Yangzijiang Shipbuilding | BS6 | 5,215 | 32.4 | 101 | 71.77 | 8 | 19.16 | 0.37% | Industrials |
AEM | AWX | 1,074 | 9.1 | -32 | -26.62 | 13 | 3.87 | 0.36% | Technology |
SingTel | Z74 | 44,230 | 78.2 | 21 | 941.99 | 16 | 154.21 | 0.35% | Telecommunications |
SPH REIT | SK6U | 2,560 | 2.4 | -3 | -6.54 | 15 | 8.88 | 0.35% | REITs |
Raffles Medical | BSL | 2,503 | 2.9 | 1 | 6.24 | 12 | 8.11 | 0.32% | Healthcare |
Keppel Corporation | BN4 | 12,929 | 26.7 | 52 | 380.98 | 13 | 36.80 | 0.28% | Industrials |
Samudera Shipping | S56 | 493 | 2.4 | 100 | 26.04 | 16 | 1.38 | 0.28% | Industrials |
SIA | C6L | 16,308 | 27.0 | 10 | 72.37 | 9 | 43.73 | 0.27% | Industrials |
Keppel DC REIT | AJBU | 3,145 | 11.4 | -23 | -136.25 | 14 | 8.23 | 0.26% | REITs |
OCBC Bank | O39 | 55,958 | 80.0 | 14 | 565.63 | 8 | 132.75 | 0.24% | Banks |
CapitaLand Investment | 9CI | 18,462 | 31.7 | 10 | 109.07 | 14 | 34.99 | 0.19% | Financial Services |
Top Glove | BVA | 2,242 | 2.4 | -64 | -9.78 | 30 | 3.90 | 0.17% | Healthcare |
CapitaLand India Trust | CY6U | 1,393 | 3.2 | -10 | -36.79 | 13 | 2.24 | 0.16% | REITs |
Golden Agri-Resources | E5H | 3,614 | 6.7 | 24 | 16.04 | 7 | 5.61 | 0.16% | Consumer Non-Cyclicals |
First Resources | EB5 | 2,527 | 5.7 | 11 | 4.95 | 10 | 3.67 | 0.15% | Consumer Non-Cyclicals |
Far East Hospitality Trust | Q5T | 1,193 | 1.1 | 7 | 0.28 | 12 | 1.52 | 0.13% | REITs |
Mapletree Pan Asia Commercial Trust | N2IU | 8,954 | 27.7 | -10 | -127.47 | 12 | 11.12 | 0.12% | REITs |
CapitaLand Integrated Commercial Trust | C38U | 13,331 | 48.8 | 1 | 97.26 | 16 | 14.42 | 0.11% | REITs |
Hong Fok | H30 | 791 | 1.4 | 28 | 18.99 | 7 | 0.81 | 0.10% | Real Estate (excl. REITs) |
City Developments | C09 | 7,373 | 14.8 | 26 | 298.44 | 11 | 7.24 | 0.10% | Real Estate (excl. REITs) |
SingPost | S08 | 1,204 | 1.9 | -16 | -7.26 | 6 | 1.14 | 0.09% | Industrials |
ST Engineering | S63 | 10,741 | 20.9 | -4 | -89.81 | 11 | 9.45 | 0.09% | Industrials |
ISDN | I07 | 164 | 1.0 | -47 | -3.43 | 3 | 0.13 | 0.08% | Technology |
Sheng Siong | OV8 | 2,406 | 3.7 | 14 | 68.68 | -2 | 1.85 | 0.08% | Consumer Non-Cyclicals |
SGX | S68 | 9,836 | 24.1 | 2 | 25.71 | 13 | 7.20 | 0.07% | Financial Services |
DBS | D05 | 90,746 | 148.5 | 13 | 0.31 | 10 | 61.88 | 0.07% | Banks |
Dyna-Mac | NO4 | 185 | 1.9 | 98 | 3.01 | 0 | 0.10 | 0.06% | Industrials |
Olam Group | VC2 | 5,337 | 2.9 | -16 | -31.36 | 11 | 2.73 | 0.05% | Consumer Non-Cyclicals |
Aztech Global | 8AZ | 621 | 1.1 | 1 | -7.36 | 9 | 0.26 | 0.04% | Technology |
Thai Beverage | Y92 | 15,449 | 13.7 | -4 | -61.46 | 9 | 6.09 | 0.04% | Consumer Non-Cyclicals |
Parkway Life REIT | C2PU | 2,420 | 2.7 | -20 | -20.43 | 8 | 0.85 | 0.04% | REITs |
Golden Energy Resources | AUE | 2,031 | 5.4 | 166 | 17.13 | -12 | 0.53 | 0.03% | Energy/ Oil & Gas |
Keppel Infrastructure Trust | A7RU | 2,696 | 3.0 | 6 | -6.35 | 7 | 0.69 | 0.03% | Utilities |
DFI Retail Group | D01 | 4,667 | 2.7 | -8 | -9.64 | 14 | 0.89 | 0.02% | Consumer Non-Cyclicals |
ESR-LOGOS REIT | J91U | 2,352 | 4.1 | -23 | -24.75 | 9 | 0.42 | 0.02% | REITs |
UOL | U14 | 5,498 | 8.6 | -6 | -4.85 | 9 | 0.72 | 0.01% | Real Estate (excl. REITs) |
Wilmar International | F34 | 25,403 | 30.1 | 2 | 74.45 | 16 | 3.26 | 0.01% | Consumer Non-Cyclicals |
OUE Commercial REIT | TS0U | 1,858 | 0.7 | -18 | -15.56 | 11 | 0.20 | 0.01% | REITs |
Rex International | 5WH | 293 | 5.4 | -25 | -13.73 | -2 | 0.02 | 0.01% | Energy/ Oil & Gas |
The Hour Glass | AGS | 1,383 | 1.4 | 7 | 41.61 | 8 | 0.08 | 0.01% | Consumer Cyclicals |
Wing Tai | W05 | 1,148 | 0.9 | -12 | -37.23 | 6 | -0.05 | 0.00% | Real Estate (excl. REITs) |
Emperador Inc. | EMI | 7,632 | 2.1 | N/A | -3.44 | -1 | -0.68 | -0.01% | Consumer Non-Cyclicals |
CapitaLand Ascott Trust | HMN | 3,273 | 7.4 | -3 | 9.10 | 9 | -0.41 | -0.01% | REITs |
CapitaLand China Trust | AU8U | 1,791 | 4.9 | -5 | -71.86 | 14 | -0.30 | -0.02% | REITs |
NIO Inc. | NIO | 21,626 | 5.1 | N/A | -23.50 | -7 | -4.81 | -0.02% | Consumer Cyclicals |
Starhill Global REIT | P40U | 1,214 | 1.2 | -12 | -12.08 | 11 | -0.29 | -0.02% | REITs |
SIA Engineering | S59 | 2,505 | 1.4 | 2 | 13.01 | 9 | -0.80 | -0.03% | Industrials |
Keppel Pacific Oak US REIT | CMOU | 821 | 0.9 | -21 | -17.34 | 13 | -0.39 | -0.05% | REITs |
Hutchison Ports Holdings Trust | NS8U | 2,163 | 2.3 | -11 | 12.51 | -1 | -1.15 | -0.05% | Industrials |
Japfa | UD2 | 1,040 | 1.1 | -14 | 1.02 | 1 | -0.61 | -0.06% | Consumer Non-Cyclicals |
Silverlake Axis | 5CP | 828 | 0.6 | 23 | 13.62 | 7 | -0.60 | -0.07% | Technology |
Yoma Strategic | Z59 | 215 | 0.9 | -27 | -1.18 | 19 | -0.16 | -0.07% | Real Estate (excl. REITs) |
Mapletree Industrial Trust | ME8U | 6,084 | 16.8 | -12 | -177.94 | 7 | -5.32 | -0.09% | REITs |
mm2 Asia | 1B0 | 126 | 0.6 | -12 | -4.27 | 2 | -0.12 | -0.09% | Consumer Cyclicals |
Yanlord Land | Z25 | 1,874 | 1.3 | -7 | -14.29 | 7 | -1.74 | -0.09% | Real Estate (excl. REITs) |
Manulife US REIT | BTOU | 931 | 2.0 | -39 | -25.37 | 12 | -0.87 | -0.09% | REITs |
Daiwa House Logistics Trust | DHLU | 429 | 0.7 | -17 | -22.96 | 19 | -0.41 | -0.10% | REITs |
Parkson Retail Asia ^ | O9E | 36 | 0.6 | 382 | 0.14 | 10 | -0.04 | -0.10% | Consumer Cyclicals |
Jardine C&C | C07 | 11,818 | 13.7 | 51 | 124.57 | -2 | -12.44 | -0.11% | Consumer Cyclicals |
AIMS APAC REIT | O5RU | 905 | 1.7 | -7 | -24.52 | 14 | -0.99 | -0.11% | REITs |
Straits Trading Co. | S20 | 1,026 | 0.9 | -17 | -2.81 | 9 | -1.13 | -0.11% | Materials & Resources |
Mapletree Logistics Trust | M44U | 7,743 | 25.3 | -11 | -77.64 | 14 | -8.87 | -0.11% | REITs |
StarHub | CC3 | 1,832 | 1.5 | -18 | -24.69 | 4 | -2.12 | -0.12% | Telecommunications |
Cromwell European REIT | CWBU | 1,241 | 0.9 | -39 | -12.60 | 5 | -1.53 | -0.12% | REITs |
Sasseur REIT | CRPU | 945 | 1.5 | -3 | -38.61 | 14 | -1.31 | -0.14% | REITs |
Jardine Matheson | J36 | 18,747 | 25.4 | -9 | -38.28 | -4 | -27.22 | -0.15% | Industrials |
Bumitama Agri | P8Z | 1,023 | 1.0 | 16 | 11.43 | 1 | -1.56 | -0.15% | Consumer Non-Cyclicals |
RH PetroGas | T13 | 147 | 3.3 | 9 | -5.60 | -1 | -0.23 | -0.15% | Energy/ Oil & Gas |
Riverstone | AP4 | 897 | 2.9 | 7 | 31.41 | 10 | -1.40 | -0.16% | Healthcare |
Hongkong Land | H78 | 12,557 | 16.3 | -20 | 0.45 | -10 | -22.40 | -0.18% | Real Estate (excl. REITs) |
Digital Core REIT | DCRU | 904 | 4.8 | -47 | -13.55 | -2 | -1.80 | -0.20% | REITs |
Frasers Logistics & Commercial Trust | BUOU | 4,066 | 13.4 | -23 | -69.65 | 6 | -8.25 | -0.20% | REITs |
Lendlease REIT | JYEU | 1,624 | 6.2 | -13 | -9.06 | 8 | -3.59 | -0.22% | REITs |
Haw Par | H02 | 2,068 | 1.1 | -16 | -29.25 | 4 | -4.62 | -0.22% | Healthcare |
CapitaLand Ascendas REIT | A17U | 11,469 | 33.2 | -2 | -110.36 | 11 | -29.08 | -0.25% | REITs |
Sembcorp Industries | U96 | 5,425 | 13.7 | 56 | 176.97 | 9 | -14.10 | -0.26% | Utilities |
Frasers Centrepoint Trust | J69U | 3,442 | 7.4 | -8 | -42.80 | 6 | -10.29 | -0.30% | REITs |
Chip Eng Seng | C29 | 565 | 1.0 | 84 | 10.54 | 0 | -1.81 | -0.32% | Real Estate (excl. REITs) |
Prime US REIT | OXMU | 806 | 1.1 | -33 | -23.57 | 4 | -2.72 | -0.34% | REITs |
NetLink NBN Trust | CJLU | 3,351 | 6.9 | -9 | -114.09 | 7 | -11.87 | -0.35% | Telecommunications |
MarcoPolo Marine | 5LY | 152 | 0.9 | 59 | 3.35 | 23 | -0.54 | -0.35% | Industrials |
Suntec REIT | T82U | 4,026 | 18.5 | -2 | -8.34 | 2 | -14.57 | -0.36% | REITs |
Frasers Hospitality Trust | ACV | 828 | 1.9 | -5 | 6.53 | 2 | -3.67 | -0.44% | REITs |
Jiutian Chemical * | C8R | 147 | 2.6 | 6 | 19.24 | 4 | -0.87 | -0.59% | Materials & Resources |
Keppel REIT | K71U | 3,349 | 10.2 | -17 | -54.19 | 1 | -30.75 | -0.92% | REITs |
Yangzijiang Financial | YF8 | 1,273 | 14.6 | N/A | -235.52 | 0 | -13.70 | -1.08% | Financial Services |
ComfortDelGro | C52 | 2,708 | 14.4 | -7 | -108.95 | -2 | -30.53 | -1.13% | Industrials |
Geo Energy Resources | RE4 | 499 | 6.5 | 28 | -15.79 | -8 | -6.07 | -1.22% | Energy/ Oil & Gas |
SATS | S58 | 3,002 | 13.3 | -31 | -148.58 | 2 | -43.01 | -1.43% | Industrials |
The Place Holdings | E27 | 118 | 0.8 | -75 | -8.03 | -33 | -1.76 | -1.50% | Financial Services |
Nanofilm Technologies | MZH | 835 | 4.2 | -66 | -94.83 | -27 | -19.01 | -2.28% | Technology |
Average | 6.2 | 8.0 | |||||||
Total | 627,080 | 1,178 | 1,002.5 | 729.8 |