SGX Market Updates

S-REITs' Discount to Book Value Narrows on Global Rate Outlook


PUBLISHED ON |

21 November 2022

  • With global inflation set to outpace global growth by 5% in 2022, the FTSE ST REIT Index has generated a 10% decline in total return this year, with the FTSE EPRA/NAREIT Developed Index declining 22%. This has brought the 5-year total return of the FTSE ST REIT Index to 15%, compared to 8% for the FTSE EPRA/NAREIT Developed Index.

  • The FTSE ST REIT Index ended 18 Nov at a 7% discount to book value, up from a 16% discount a month ago. Since 21 Oct, majority expectations for the 14 FOMC Fed Funds Rate have markedly moved from 75bps to 50bps, while the 10-year U.S. Treasury yields have declined from above 4.2% to below 3.8%.

  • The most defensive REITs and property trusts in the 2022-to-date included CDL Hospitality Trusts, Far East Hospitality Trust, Sabana Industrial REIT, CapitaLand Integrated Commercial Trust and Suntec REIT. Sabana Industrial REIT, CapitaLand Integrated Commercial Trust and CDL Hospitality Trusts also ranked among the 5 Trusts that booked the highest year-to-date net institutional fund inflows proportionate to current market value.


Over the past month, the FTSE ST REIT Index has generated a 12.0% total return on the back of a marginally less hawkish outlook for US Interest rates. This has also seen the US 10-Year Treasury yields decline from above 4.2% on 21 Oct to below 3.8% at present, with the US Dollar Index also declining from above 113 to near 107.

The partial rebound of the S-REIT Sector over the past month has also pared the FTSE ST REIT Index decline in total return for the 2022-to-date (as of 18 Nov) to 10%, compared to the FTSE EPRA/NAREIT Developed Index declining 22%. This brings the 5-year total return of the FTSE ST REIT Index to 15%, compared to 8% for the FTSE EPRA/NAREIT Developed Index.

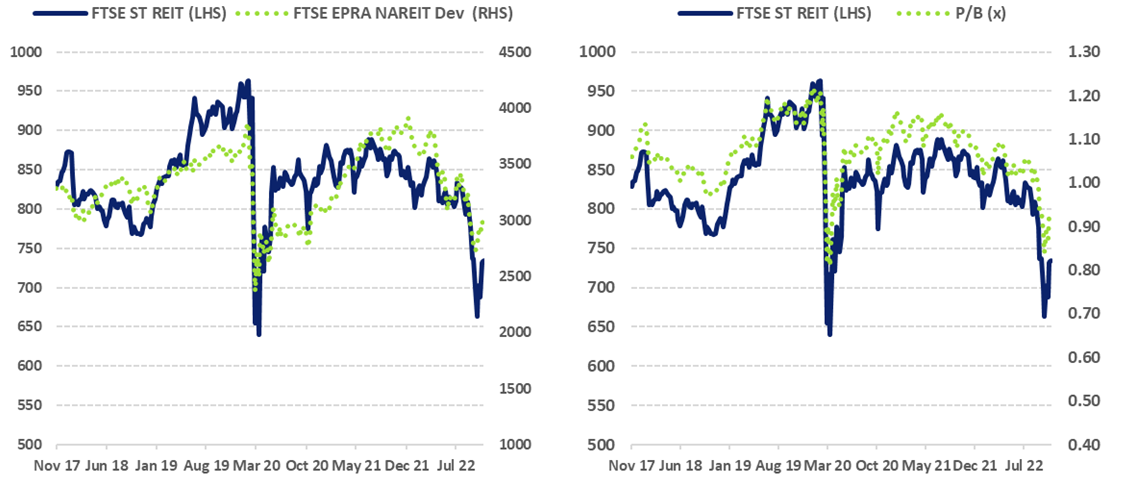
As illustrated below, the FTSE ST REIT Index has maintained some directional correlation, albeit not statistically significant correlation to the FTSE EPRA/NAREIT Developed Index over the past 5 years. While the FTSE EPRA/NAREIT Developed Index is more than 60% weighted to US-listed REITs, both S-REITs and US-listed REITs do compete with US Treasury Yields for fund inflows. The aforementioned decline in 10-Year US Treasury Yields coincided with the P/B ratio of the FTSE ST REIT Index increasing from 0.84x to 0.93.

Over the past 5 years, there have only been 6 weeks when the P/B ratio of the FTSE ST REIT Index ended the week below 0.90x.


S-REITs Historical Price-to-Book vs FTSE ST REIT Index


Overall the S-REIT sector has seen more than S$1 billion of net institutional fund outflows in the 2022-to-date as of 18 Nov, with 32 of the trusts booking net institutional fund outflows and 8 of the trusts booking net institutional fund inflows. The 5 S-REITs that saw the highest net institutional fund inflows currently average a 0.85x P/B ratio, whereas the 5 S-REITs that booked the highest net institutional fund outflows currently average a 1.15x P/B ratio.

The following 5 S-REITs/Trusts saw the highest net institutional fund inflows in the 2022-to-date averaged 2.3% total return:


The following 5 S-REITs/Trusts saw the highest net institutional fund outflows in the 2022-to-date averaged negative 10.1% in total return:


The table below details SGX listed REITs and Property Trusts' returns and net institutional fund flow in 2022-to-date, sorted by the averaged daily turnover in S$.

SGX Listed REITs & Property Trusts SGX
Code
Average Daily
Turnover
S$M
Market
Cap
S$M
YTD
Total
Return
%
QTD
Total
Return
%
YTD Net
institutional
Fund Flow
S$M
P/B
(x)
CapitaLand Integrated Commercial Trust C38U 49.0 13,463 6 2 102.7 0.96
CapitaLand Ascendas REIT A17U 33.2 11,553 2 -2 -110.5 1.12
Mapletree Pan Asia Commercial Trust N2IU 27.7 9,163 3 -7 -127.7 0.94
Mapletree Logistics Trust M44U 25.3 7,936 7 -9 -72.5 1.05
Suntec REIT T82U 18.6 4,026 -7 -2 -7.0 0.62
Mapletree Industrial Trust ME8U 16.8 6,219 -2 -10 -174.8 1.13
Frasers Logistics & Commercial Trust BUOU 13.4 4,214 -4 -20 -69.3 0.87
Keppel DC REIT AJBU 11.5 3,180 9 -22 -136.4 1.35
Keppel REIT K71U 10.2 3,387 -9 -16 -52.8 0.63
Frasers Centrepoint Trust J69U 7.4 3,459 -4 -7 -42.9 0.87
CapitaLand Ascott Trust * HMN 7.4 3,291 -3 -3 9.4 0.75
Lendlease REIT JYEU 6.2 1,624 -7 -13 -9.3 0.74
CapitaLand China Trust AU8U 4.9 1,791 3 -5 -71.9 0.66
Digital Core US REIT DCRU 4.8 908 -20 -47 -13.4 0.67
ESR-LOGOS REIT J91U 4.1 2,352 -1 -23 -25.0 0.85
CapitaLand India Trust ** CY6U 3.3 1,428 17 -8 -36.9 1.03
CDL Hospitality Trusts * J85 2.9 1,559 8 12 9.2 0.96
ParkwayLife REIT C2PU 2.7 2,456 -4 -19 -19.7 1.69
SPH REIT SK6U 2.4 2,560 3 -3 -7.4 0.89
Manulife US REIT BTOU 2.0 903 -17 -41 -25.7 0.53
Frasers Hospitality Trust * ACV 1.9 838 -7 -3 6.5 0.67
AIMS APAC REIT O5RU 1.7 912 1 -6 -24.6 0.66
Sasseur REIT CRPU 1.5 952 10 -2 -38.5 0.81
StarhillGbl REIT P40U 1.2 1,214 0 -12 -12.4 0.66
Prime US REIT OXMU 1.1 811 -11 -33 -23.6 0.58
Far East Hospitality Trust * Q5T 1.1 1,193 3 7 0.3 0.70
Cromwell European REIT CWBU 0.9 1,270 -10 -37 -12.6 0.60
Keppel Pac Oak US REIT CMOU 0.9 840 2 -19 -17.3 0.70
OUE Commercial REIT TS0U 0.7 1,885 1 -17 -15.8 0.56
Daiwa House Logistics Trust DHLU 0.7 426 5 -18 -23.0 0.75
First REIT AW9U 0.4 525 -1 -8 -11.6 0.69
Elite Commercial REIT MXNU 0.4 385 7 -28 -8.4 0.79
United Hampshire US REIT ODBU 0.3 388 -11 -18 -14.6 0.66
Sabana Industrial REIT M1GU 0.3 471 0 4 12.4 0.82
EC World REIT BWCU 0.3 393 -3 -32 -5.9 0.61
IREIT Global UD1U 0.3 613 6 -13 -12.3 0.65
Lippo Malls Indonesia Trust D5IU 0.2 239 -11 -38 -8.2 0.26
Dasin Retail Trust ** CEDU 0.2 221 -4 -20 -1.7 0.23
ARA US Hospitality Trust * XZL 0.1 293 -5 -21 0.6 0.52
BHG Retail REIT BMGU 0.1 259 -7 -15 1.5 0.57

Note: Data as of 18 Nov 2022 (Source: SGX, Refinitiv, Bloomberg).
* Stapled Trust.
** Business Trust.


This article is provided by SGX My Gateway.


SGX My Gateway

SGX's investor education portal with market, product and investment information and events. Sign up now at sgx.com/mygateway to receive our investment updates and economic calendar.

This document is not intended for distribution to, or for use by or to be acted on by any person or entity located in any jurisdiction where such distribution, use or action would be contrary to applicable laws or regulations or would subject Singapore Exchange Limited (“SGX”) to any registration or licensing requirement. This document is not an offer or solicitation to buy or sell, nor financial advice or recommendation for any investment product. This document is for general circulation only. It does not address the specific investment objectives, financial situation or particular needs of any person. Advice should be sought from a financial adviser regarding the suitability of any investment product before investing or adopting any investment strategies. Use of and/or reliance on this document is entirely at the reader’s own risk. Further information on this investment product may be obtained from www.sgx.com. Investment products are subject to significant investment risks, including the possible loss of the principal amount invested. Past performance of investment products is not indicative of their future performance. Examples provided are for illustrative purposes only. While each of SGX and its affiliates (collectively, the SGX Group Companies) have taken reasonable care to ensure the accuracy and completeness of the information provided, each of the SGX Group Companies disclaims any and all guarantees, representations and warranties, expressed or implied, in relation to this document and shall not be responsible or liable (whether under contract, tort (including negligence) or otherwise) for any loss or damage of any kind (whether direct, indirect or consequential losses or other economic loss of any kind, including without limitation loss of profit, loss of reputation and loss of opportunity) suffered or incurred by any person due to any omission, error, inaccuracy, incompleteness, or otherwise, any reliance on such information, or arising from and/or in connection with this document. The information in this document may have been obtained via third party sources and which have not been independently verified by any SGX Group Company. No SGX Group Company endorses or shall be liable for the content of information provided by third parties. The SGX Group Companies may deal in investment products in the usual course of their business, and may be on the opposite side of any trades. SGX is an exempt financial adviser under the Financial Advisers Act (Cap. 110) of Singapore. The information in this document is subject to change without notice. This document shall not be reproduced, republished, uploaded, linked, posted, transmitted, adapted, copied, translated, modified, edited or otherwise displayed or distributed in any manner without SGX’s prior written consent.


SGX Stock / REIT Search

Advertisement

Trust Bank Referral Code

Advertisement