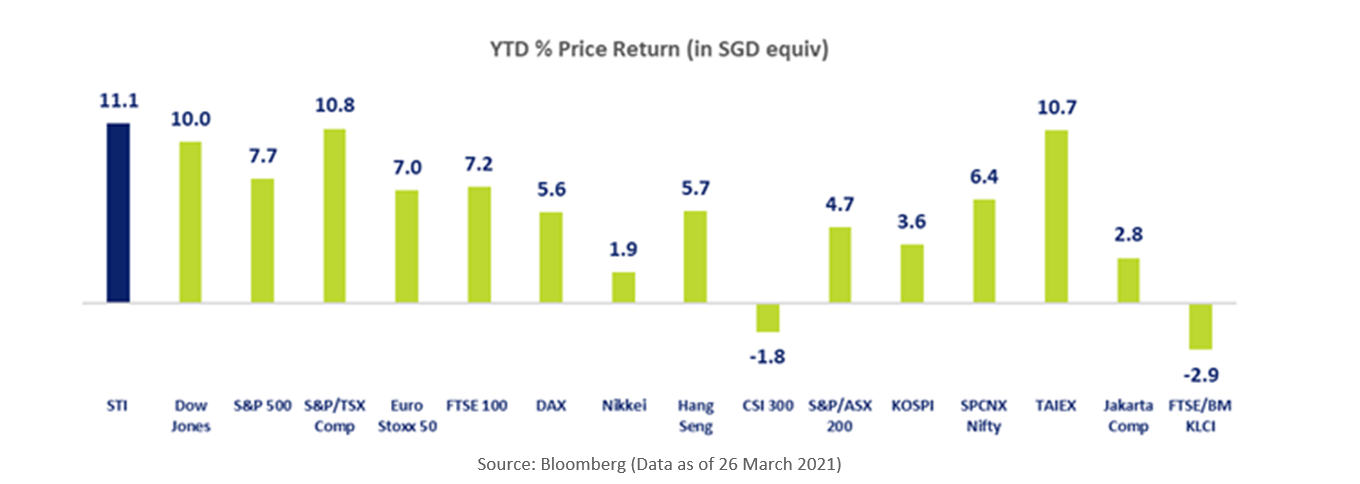
With 3 sessions remaining for the March 2021, the STI has generated an 11.1% price gain year-to-date, outpacing all the major world benchmarks, with the next best performers the S&P/Toronto Stock Exchange Composite Index (+10.8%) and the Taiwan Stock Exchange Weighted Index (+10.7%).
The March quarter is also poised to be the STI’s best start to a calendar year since 2012, when the STI gained 13.8% in 1Q12. Similar to the 10.2% start to 1Q17, the STI has more than doubled the gains of the FTSE Asia Pacific Index.
As many as 11 of the STI stocks - Jardine Strategic, Yangzijiang Shipbuilding, Singapore Airlines, Hongkong Land, Jardine Matheson, CapitaLand, OCBC, Wilmar International, Jardine Cycle & Carriage, DBS and UOB have generated double digit gains in the quarter-to-date. Globally, banks were the strongest of the sectors for the past 12 weeks.
Jardine Strategy is scheduled to be deleted from the STI effective 13 April, should Jardine Matheson’s cash acquisition of Jardine Strategy be approved at the 12 April Special General Meeting. This means the stock of the STI Reserve List with the highest market cap as of 8 April (currently Frasers Logistics & Commercial Trust) will join the benchmark.
With 3 sessions remaining for the March 2021 Quarter, the Straits Times Index (“STI”) has generated an 11.1% price gain, outpacing all the major world benchmarks, with the next best performers the S&P/Toronto Stock Exchange Composite Index and the Taiwan Stock Exchange Weighted Index. These returns are on a price-alone basis and in SGD terms. Commodity price gains have supported the S&P/Toronto Stock Exchange Composite Index and strong global demand for semiconductors has supported the Taiwan Stock Exchange Weighted Index. For the overarching market driver, globally administered vaccine doses are set to quadruple the number of globally recorded COVID-19 cases this week.
For the STI, rotation into global banks buoyed the Index through much of the past 12 weeks while two constituents, Jardine Strategic and CapitaLand, have seen significant corporate actions through strategic restructures. The top quartile of global banks have generated a median gain of 15% in the March quarter-to-date, with the 3 Singapore-listed banks moving in unison, also averaging 15% gains.
The March quarter is also poised to be the STI’s best start to a calendar year since 2012, when the STI gained 13.8% in 1Q12. Similar to the 10.2% start to 1Q17, the STI has more than doubled the gains of the FTSE Asia Pacific Index. As many as 11 of the STI stocks have generated double digit gains in the quarter-to-date.
On the economic front, Singapore reported strong Industrial Production numbers on Friday, with the preliminary housing price data, which has also been comparatively robust, due this Thursday. Singapore’s Industrial Production in February grew 16.4% year-on-year, and on a seasonally adjusted month-on-month basis, manufacturing output increased 1.6%. On Thursday, URA will report its preliminary gauge on Singapore’s private residential property prices for 1Q21, which gained 2.1% in 4Q20 and 0.8% in 3Q20.
In Washington, President Biden has just announced he wants to double up his target to 200 million vaccine doses in his first 100 days, and this week his administration is expected to start obtaining buy-ins for the ambitious, potentially ~US$3 trillion Infrastructure and climate plan.
The STI stocks and STI Reserve List is tabled below and sort by market capitalisation.
STI Stocks | SGX Code |
Market Cap S$b |
5-Day Price Change % |
MTD Price Change % |
YTD Price Change % |
YTD Total Return % |
Sector |
---|---|---|---|---|---|---|---|
DBS GROUP | D05 | 73.08 | 0 | 7 | 14 | 14 | Financial Services |
JARDINE MATHESON | J36 | 64.87 | -2 | 27 | 19 | 22 | Industrials |
OCBC | O39 | 52.80 | 2 | 7 | 17 | 17 | Financial Services |
JARDINE STRATEGIC | J37 | 49.64 | -1 | 30 | 36 | 36 | Industrials |
UOB | U11 | 42.96 | 0 | 4 | 14 | 14 | Financial Services |
SINGTEL | Z74 | 40.29 | 2 | 4 | 6 | 6 | Telecommunications |
WILMAR INTERNATIONAL | F34 | 34.27 | 3 | 3 | 17 | 17 | Consumer Non-Cyclicals |
CAPITALAND | C31 | 20.03 | 16 | 21 | 17 | 17 | Real Estate (excl. REITs) |
THAI BEVERAGE | Y92 | 18.09 | 0 | -2 | -2 | 0 | Consumer Non-Cyclicals |
SINGAPORE AIRLINES | C6L | 16.43 | -3 | 11 | 29 | 29 | Industrials |
HONGKONG LAND | H78 | 15.49 | 0 | 3 | 22 | 26 | Real Estate (excl. REITs) |
CAPITALAND INTEGRATED COMMERCIAL TRUST | C38U | 13.85 | -2 | 2 | -1 | 0 | REITs |
ASCENDAS REIT | A17U | 12.59 | -2 | 3 | 2 | 2 | REITs |
ST ENGINEERING | S63 | 12.04 | 0 | 3 | 1 | 1 | Industrials |
GENTING SINGAPORE | G13 | 10.98 | -3 | 6 | 7 | 7 | Consumer Cyclicals |
SINGAPORE EXCHANGE | S68 | 10.60 | 0 | -1 | 7 | 8 | Financial Services |
KEPPEL CORPORATION | BN4 | 9.46 | 1 | 2 | -3 | -3 | Industrials |
JARDINE CYCLE & CARRIAGE | C07 | 8.96 | -1 | 8 | 16 | 16 | Consumer Cyclicals |
MAPLETREE LOGISTICS TRUST | M44U | 8.27 | 3 | 4 | -4 | -3 | REITs |
DAIRY FARM INTERNATIONAL | D01 | 7.92 | -2 | 2 | 6 | 9 | Consumer Non-Cyclicals |
CITY DEVELOPMENTS | C09 | 7.18 | 3 | 8 | -1 | -1 | Real Estate (excl. REITs) |
MAPLETREE COMMERCIAL TRUST | N2IU | 7.00 | 1 | 3 | -1 | -1 | REITs |
UOL GROUP | U14 | 6.63 | 1 | 6 | 2 | 2 | Real Estate (excl. REITs) |
MAPLETREE INDUSTRIAL TRUST | ME8U | 6.44 | 1 | 3 | -5 | -4 | REITs |
VENTURE CORPORATION | V03 | 5.79 | -1 | 4 | 3 | 3 | Technology (Hardware/ Software) |
YANGZIJIANG SHIPBUILDING | BS6 | 4.93 | 4 | 20 | 34 | 34 | Industrials |
SATS | S58 | 4.83 | -4 | -2 | 8 | 8 | Industrials |
KEPPEL DC REIT | AJBU | 4.43 | 0 | -1 | -4 | -2 | REITs |
COMFORTDELGRO | C52 | 3.73 | 1 | 7 | 3 | 3 | Industrials |
SEMBCORP INDUSTRIES | U96 | 3.28 | 3 | 6 | 8 | 8 | Utilities |
Jardine Strategic is scheduled to be deleted from the STI effective 13 April, should Jardine Matheson’s cash acquisition of Jardine Strategic be approved at the 12 April Special General Meeting. This means the stock of the STI Reserve List with the highest market cap as of 8 April (currently Frasers Logistics & Commercial Trust) will join the benchmark. Currently Frasers Logistic & Commercial Trust has a market capitalisation of S$4.90 billion, with Keppel REIT maintaining a market capitalisation of S$4.51 billion.
STI Reserve List | SGX Code |
Market Cap S$b |
5-Day Price Change % |
MTD Price Change % |
YTD Price Change % |
YTD Total Return % |
Sector |
---|---|---|---|---|---|---|---|
FRASERS LOGISTICS & COMMERCIAL TRUST | BUOU | 4.90 | -5 | 4 | 1 | 1 | REITs |
KEPPEL REIT | K71U | 4.51 | 3 | 6 | 10 | 13 | REITs |
SUNTEC REIT | T82U | 4.46 | 0 | 8 | 5 | 7 | REITs |
FRASERS CENTREPOINT TRUST | J69U | 4.20 | -4 | -2 | 0 | 0 | REITs |
NETLINK NBN TRUST | CJLU | 3.70 | 0 | 0 | -2 | -2 | Telecommunications |
This article is provided by SGX My Gateway.
SGX My Gateway
SGX's investor education portal with market, product and investment information and events. Sign up now at sgx.com/mygateway to receive our investment updates and economic calendar.
This document is not intended for distribution to, or for use by or to be acted on by any person or entity located in any jurisdiction where such distribution, use or action would be contrary to applicable laws or regulations or would subject Singapore Exchange Limited (“SGX”) to any registration or licensing requirement. This document is not an offer or solicitation to buy or sell, nor financial advice or recommendation for any investment product. This document is for general circulation only. It does not address the specific investment objectives, financial situation or particular needs of any person. Advice should be sought from a financial adviser regarding the suitability of any investment product before investing or adopting any investment strategies. Use of and/or reliance on this document is entirely at the reader’s own risk. Further information on this investment product may be obtained from www.sgx.com. Investment products are subject to significant investment risks, including the possible loss of the principal amount invested. Past performance of investment products is not indicative of their future performance. Examples provided are for illustrative purposes only. While each of SGX and its affiliates (collectively, the “SGX Group Companies”) have taken reasonable care to ensure the accuracy and completeness of the information provided, each of the SGX Group Companies disclaims any and all guarantees, representations and warranties, expressed or implied, in relation to this document and shall not be responsible or liable (whether under contract, tort (including negligence) or otherwise) for any loss or damage of any kind (whether direct, indirect or consequential losses or other economic loss of any kind, including without limitation loss of profit, loss of reputation and loss of opportunity) suffered or incurred by any person due to any omission, error, inaccuracy, incompleteness, or otherwise, any reliance on such information, or arising from and/or in connection with this document. The information in this document may have been obtained via third party sources and which have not been independently verified by any SGX Group Company. No SGX Group Company endorses or shall be liable for the content of information provided by third parties. The SGX Group Companies may deal in investment products in the usual course of their business, and may be on the opposite side of any trades. SGX is an exempt financial adviser under the Financial Advisers Act (Cap. 110) of Singapore. The information in this document is subject to change without notice. This document shall not be reproduced, republished, uploaded, linked, posted, transmitted, adapted, copied, translated, modified, edited or otherwise displayed or distributed in any manner without SGX’s prior written consent.