SGX Market Updates

Banks & Real Estate Stocks Led STI into 2H20


PUBLISHED ON |

07 July 2020

  • The STI’s performance in 2H20 will largely be determined by the performance of its two biggest Sectors - Banks and Real Estate. While both of these Sectors lagged globally for much of 1H20 - they have led STI stocks in the first four sessions of July, seeing similar sized net institutional inflows.

  • One-third of the STI constituents represent the Real Estate Sector, that now maintain a 22% Index weightage. Together, the four developers and six REITs have averaged a 5% total return in the first four sessions of July, bringing their average annualised 10 year total return to 123%.

  • Relevant 2H20 Sector drivers could include: Bank’s abilities to generate income, tier 1 capital to risk-weighted assets & non-performing loan ratios; while Real Estate stocks could be distinguished by their capital management, ability to recycle assets and diversity of property pipelines and portfolios.


In the short time since the end of 1H20, the Straits Times Index (“STI”) has gained 3.9%, led by similar gains in its Bank and Real Estate stocks. As many as three of the 10 Real Estate stocks, were amongst the STI’s five best performers over the past four sessions. Since the end of June, the 10 Real Estate stocks have averaged a 4.5% gain, whilst the three banks averaged a marginally higher 4.6% gain.


STI Sector Average Total Returns


As discussed in a recent Market Update - Singapore’s Most Defensive Stocks in 1H20, in 1H20 the top quartile of global banks by market value generated a median decline of 21% in total return, with the top quartile of global Real Estate stocks generating a median decline of 16%. While the STI bank and real estate stocks did not buck the 1H20 trend, they averaged less declines in total returns than those respective median declines generated their global peers. 


ROE & Debt-to-Assets a Comparative Strength of STI Banks & Real Estate Stocks 

Accommodative monetary policy and economic lockdowns have meant that global banks have had to contend with a sudden reduction in interest rate margins and overall demand for financing, while needing to boost loan provisions. At the same time real estate developers, operators and managers had to grapple with exogenous declines in property sales and leases.

Aside from the comparatively more defensive performances of the STI’s banks and Real Estate stocks in 1H20, the two key index segments maintain competitive financial ratios.

Going into 2020, the STI’s three banks maintained a higher average ROE at the end of FY19 than the top quartile of global banking stocks by market value. The STI’s 10 Real Estate stocks also averaged a lower debt-to-asset ratio than the top quartile of global real estate stocks by market value.


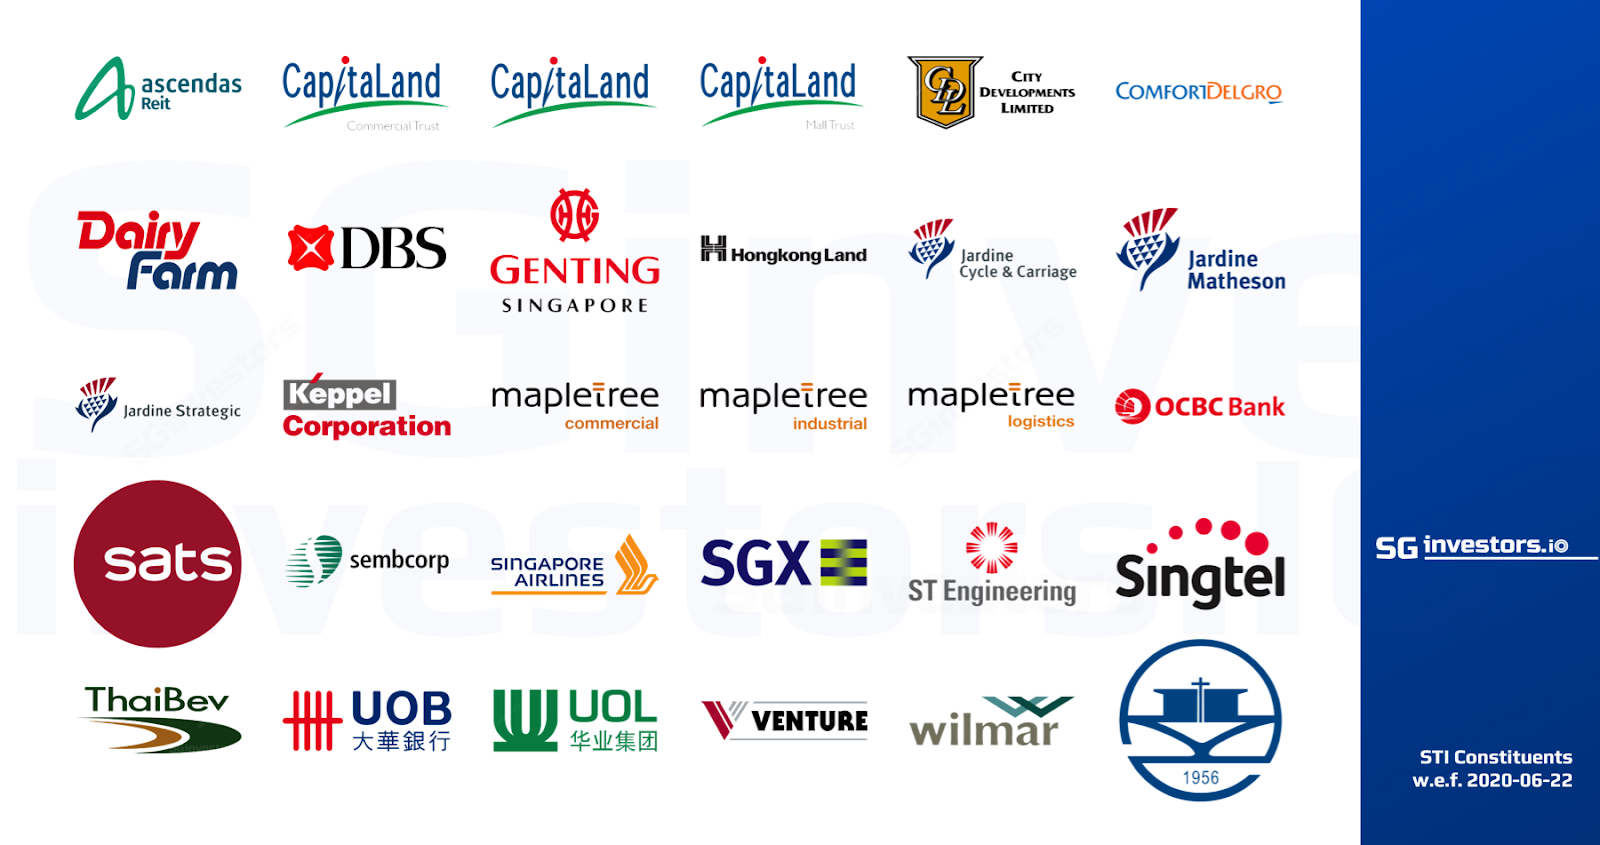
STI Constituents ROE Debt/Asset Ratio


  • ROE is a broad indicator of a banking stock’s ability to generate income. The top quartile of global banking stocks by market value generated a median decline of 21% in 1H20. However, the global bank stocks with a return-on-equity (“ROE”) at 12% or above in the their latest filing, saw a lesser median decline of 15% in 1H20. This compared to a higher median 24% decline for the global bank stocks with an ROE below 8%, and an even greater median 28% decline for the bank stocks with an ROE below 4%. Tier 1 capital to risk-weighted assets, non-performing loan ratios and dividend yields are also more Sector-specific indicators, with ability to digitalise a key driver in 2020.

  • Low Debt-to-Asset ratios indicate real estate stocks’ ability to remain solvent in downturns. The top quartile of global Real Estate stocks by market value generated a median decline of 16% in 1H20. The global Real Estate stocks with a debt-to-asset ratio below 20% in the their last FY, saw a lesser median 9% decline in 1H20, while those real estate stocks with a debt-to-asset ratio less than 10%, saw a median 0.4% gain in 1H20. This compared to median 19% declines for the global real estate stocks with a debt-to-asset ratio above 40%. Prudent capital management, ability to recycle assets and diversity of property pipelines and portfolios are other more specific-Sector indicators.


Like the regional stock market, Banks and Real Estate stocks make up significant portion of the benchmarks, and performance of the STI and FTSE ASEAN All-Share Index will depend on how these two sectors fair. As noted above, For their last full FY, the STI’s banks averaged a  12% ROE, while the 10 Real Estate Stocks averaged a 31% debt-to-asset ratio.


Banks Make up 38% of the STI Weightage

For the Banks - the trio of DBS Group Holdings, Oversea-Chinese Banking Corp and United Overseas Bank declined 17.6% in 1H20. With the gains in the July month to date,  this has brought their average 10 year total return to 83.0%, outperforming the STI’s 31.3% total return. Thus the STI’s largest sector has been one of its best performers over the past 10 years. The trio also outperformed the STI in the most recent month of June, generating average total returns of 6.5%, compared to 3.8% for the STI.

Stock SGX
Code
July MTD
Net Insti Flow
S$
2020 YTD
Net Insti Flow
S$
July MTD
Total Return
%
2020 YTD
Total Return
%
10Y
Total Return
%
Last FY
ROE
DBS D05 $39,592,889 -$1,249,554,499 5.6 -12.2 135.3 12.8
UOB U11 $2,035,426 -$1,185,574,114 4.6 -17.0 58.7 11.7
OCBC Bank O39 $5,943,666 -$637,364,466 3.7 -12.2 54.9 10.8
Total   $47,571,980 -$3,072,493,079        
Average       4.6 -13.8 83.0 11.7

Source: SGX, Bloomberg, Refinitiv (Data as of 6 July 2020)

According to their respective earnings releases, while net Interest Margins are impacted by interest rate cuts, with credit costs and allowances impacted by declining growth, operational resilience and balance sheet strengths are likely to be an area of focus. 


Real Estate Stocks Make up 22% of the STI Weightage 

For the Real Estate Sector – in 1H20 the iEdge SG Real Estate Developers & Operators Index declined 13.8% while the more defensive iEdge S-REIT Index declined 9.3%. Singapore lists a number of Real Estate Developers & Operators that are focused on the local economy in addition to the region. This has also transcended into the REIT Sector which is now viewed as a regional, if not global platform.

Stock SGX
Code
July MTD
Net Insti Flow
S$
2020 YTD
Net Insti Flow
S$
July MTD
Total Return
%
2020 YTD
Total Return
%
10Y
Total Return
%
Last FY
Debt/Assets
Ascendas REIT A17U $5,285,695 $280,141,923 3.5 11.6 224.0 37.7
CapitaLand Mall Trust C38U $869,601 -$97,262,687 6.6 -13.6 77.4 30.4
Mapletree Logistics Trust M44U $16,275,934 $105,402,998 4.6 18.9 365.4 40.4
CapitaLand C31 $3,468,952 -$56,319,142 4.8 -18.4 6.8 38.1
Mapletree Commercial Trust N2IU -$10,076,003 -$70,693,635 2.6 -16.1 N/A 33.4
CapitaLand Commercial Trust C61U $8,726,599 $52,619,541 7.1 -7.4 157.8 27.6
Mapletree Industrial Trust ME8U $1,176,178 $34,691,305 2.8 17.3 N/A 28.1
City Developments C09 $19,462,298 -$71,143,602 7.6 -17.2 -5.1 42.8
HongkongLand USD H78 $96,708 -$79,111,017 0.9 -21.8 14.8 11.1
UOL U14 $1,623,619 $1,285,765 4.6 -12.6 139.2 24.0
Total   $46,909,582 $99,611,450        
Average       4.5 -5.9 122.6 31.4

Source: SGX, Bloomberg, Refinitiv (Data as of 6 July 2020)


Singapore REIT managers are known for their propensity to grow portfolios, proactive capital management and strong tenant relationships. The country is also known for its progressive regulatory framework, which in April was again demonstrated with quick-to-act supportive measures that provided more REIT flexibility to access various funding options and manage cash flows. For the Singapore REITs that were listed for the duration of the 10 years ending 30 June, their average 10 year total return was 126.6%. 

Singapore also maintains a 3.03% weight in the FTSE EPRA Nareit Global Index, approximately eight-fold its 0.37% impact in the FTSE World Index.


See also Performance of STI and constituents in 2Q20.


This article is provided by SGX My Gateway.


SGX My Gateway

SGX's investor education portal with market, product and investment information and events. Sign up now at sgx.com/mygateway to receive our investment updates and economic calendar.

This document is not intended for distribution to, or for use by or to be acted on by any person or entity located in any jurisdiction where such distribution, use or action would be contrary to applicable laws or regulations or would subject Singapore Exchange Limited (“SGX”) to any registration or licensing requirement. This document is not an offer or solicitation to buy or sell, nor financial advice or recommendation for any investment product. This document is for general circulation only. It does not address the specific investment objectives, financial situation or particular needs of any person. Advice should be sought from a financial adviser regarding the suitability of any investment product before investing or adopting any investment strategies. Use of and/or reliance on this document is entirely at the reader’s own risk. Further information on this investment product may be obtained from www.sgx.com. Investment products are subject to significant investment risks, including the possible loss of the principal amount invested. Past performance of investment products is not indicative of their future performance. Examples provided are for illustrative purposes only. While each of SGX and its affiliates (collectively, the SGX Group Companies) have taken reasonable care to ensure the accuracy and completeness of the information provided, each of the SGX Group Companies disclaims any and all guarantees, representations and warranties, expressed or implied, in relation to this document and shall not be responsible or liable (whether under contract, tort (including negligence) or otherwise) for any loss or damage of any kind (whether direct, indirect or consequential losses or other economic loss of any kind, including without limitation loss of profit, loss of reputation and loss of opportunity) suffered or incurred by any person due to any omission, error, inaccuracy, incompleteness, or otherwise, any reliance on such information, or arising from and/or in connection with this document. The information in this document may have been obtained via third party sources and which have not been independently verified by any SGX Group Company. No SGX Group Company endorses or shall be liable for the content of information provided by third parties. The SGX Group Companies may deal in investment products in the usual course of their business, and may be on the opposite side of any trades. SGX is an exempt financial adviser under the Financial Advisers Act (Cap. 110) of Singapore. The information in this document is subject to change without notice. This document shall not be reproduced, republished, uploaded, linked, posted, transmitted, adapted, copied, translated, modified, edited or otherwise displayed or distributed in any manner without SGX’s prior written consent.


SGX Stock / REIT Search

Advertisement

Trust Bank God Of Fortune Referral Code PGKPSWAE Trust Bank Referral Code 🎁

Advertisement