SGX Market Updates

Recent Index Swings, Performances and Trading Highlights


PUBLISHED ON |

08 April 2020

  • Trailing volatility of Singapore stocks doubled in 1Q20, with the FTSE Singapore Index 12-month volatility at 22.0% as of the end of March, up from 10.7% at the end of December 2019. Even so, Singapore stocks were amongst the least volatile of the region over the past 12 months.

  • STI stocks that saw the biggest pick up in intra-day volatility in 1Q20 included CapitaLand Mall Trust, CapitaLand Commercial Trust, Genting Singapore, SATS & Ascendas REIT. The STI stocks that maintained the highest intra-day volatility in 1Q20 included Yangzijiang Shipbuilding, Mapletree Logistics Trust, Thai Beverage, SPH & Sembcorp Industries.

  • Over the past 12 months, declines of the STI & FTSE Singapore Index were closely in-line with the Asia Pacific region, again demonstrating strong business ties to the region, bolstered by the revenue exposure of Singapore Index stocks to the Asia Pacific.


1Q20 saw significant market declines, with the FTSE Asia Pacific Index declining 19.5% in USD terms, with intermittent, yet limited market rebounds providing short term trading opportunities for experienced investors. The market swings were even greater in the immediate region, with the FTSE ASEAN All-Share Index declining 31.3% in USD terms. ASEAN Indices have a history of maintaining a stronger directional correlation with the price of Crude Oil than the broader region, with the price of Crude Oil declining by more than 65% in 1Q20.


Market Swings

Singapore stocks saw their trailing 12-month volatility basically double over 1Q20. The FTSE Singapore Index maintained 12M volatility of 22.0% as of the end of March, which was up from 10.7% at the end of December 2019. Note the FTSE Singapore Index is not the Straits Times Index (STI), rather part of a group of standardised set of country indices provided by FTSE Russell that enable apple-for-apple comparisons for monthly performance, volatility and yield. While the FTSE Singapore Index 12M volatility notched up to 22.0%, its volatility was almost 5 percentage points less than the average volatility of 10 other Country Indices across Asia Pacific. 


APAC FTSE Country Indices


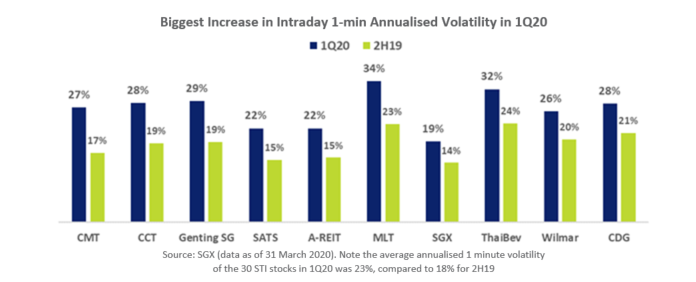
STI stocks that generated the biggest pick up in intra-day annualised volatility in 1Q20 compared to 2H19 included CapitaLand Mall Trust, CapitaLand Commercial Trust, Genting Singapore, SATS, Ascendas REIT, Mapletree Logistics Trust, Singapore Exchange, Thai Beverage PCL, Wilmar International and ComfortDelGro. This intraday annualised volatility captures the standard deviation of logarithmic midpoint price returns at one-minute intervals throughout the trading day. Note more extensive 2H19 observations are used as a base, as 4Q19 ranges can prone to more seasonal observations. 


STI Stocks Increase Volatility


Of the 10 stocks above that saw the biggest increase in 1Q20 volatility compared to 2H19, 6 were among the 10 constituents that maintained the highest intraday volatility of the STI stocks in 1Q20 – Mapletree Logistics Trust, Thai Beverage PCL, Genting Singapore, CapitaLand Commercial Trust, ComfortDelGro and CapitaLand Mall Trust. The other 4 stocks were Yangzijiang Shipbuilding (41%), Singapore Press Holdings (31%), Sembcorp Industries (29%) and Wilmar International (26%).

The 10 STI stocks that saw the highest intraday swings in 1Q20 averaged daily trading ranges of 237 basis points for the quarter, compared to the 195 basis points average for the 30 STI stocks. The individual daily trading ranges for the 30 STI stocks are tabled at the end of this report.


Market Performance

Over the past 12 months ending 31 March, the declines of the STI & FTSE Singapore Index were closely in-line with the Asia Pacific region. So much so, the FTSE Singapore Index decline was within 0.2% of the average decline for the 10 other Country Indices across Asia Pacific.

The FTSE Singapore Index declined 21.5% in USD over the 12 months ending 31 March, whilst the performances of major Asia Pacific Country Indices varied from +1.5% for the FTSE Taiwan Index to -35.8% for the FTSE Indonesia Index. By comparison the STI with significant constituent overlap to the FTSE Singapore Index, declined 23.3% in USD total return terms and 19.4% in SGD total return terms.


APAC FTSE 12 Mth Country Indices Returns


The comparative and competitive performance of the Singapore Indices again demonstrates the significant regional ties of Singapore’s largest businesses. Regional exposures are quantified regularly in Financial Statements with geographical segment reporting. As of the last available Financial Statements, 49% of the revenue of the STI in its weighted form was reported to Singapore with 44% reported to Asia Pacific countries outside of Singapore.


STI Stocks Revenue By Country


As of 31 March, Singapore still maintained the region’s highest yields. At 6.0%, the FTSE Singapore Index yield was as significantly higher than the average 3.7% yield for the of 10 other Country Indices across Asia Pacific. 


APAC FTSE Indices 12-Month Dividend Yield


Current yields are comparatively higher than their end of 2019 levels only because of the recent price declines. The FTSE Singapore Index (which includes more REITs than the STI) maintained a 12M trailing yield of 4.5% at the end of 2019, which had augmented to 6.0% at the end of March. Likewise, the STI yield increased from 4.2% at the end of 2019 to 5.5% at the end of March.

Current consensus estimates are for the STI yields to return to lower levels, based on lower dividends per share amidst the foreseeable economic contractions. This was observed in the GFC. At the end of 2008, the 12M trailing STI dividend yield rose as high as 6.1%, amidst the broad market declines. 

According to Bloomberg, gross dividends per share of the combined STI constituents for the 2009 year declined close to 25% at 6.32, compared to 8.18 for the 2008 year. Through to the end of 2009 (that included two quarters of economic contraction), the 12M trailing STI dividend yield had moderated to 2.8%. This was closer to the respective 2006 and 2007 yields of 3.2% and 3.7% than the STI’s end of 2008 yield of 6.1%.


Short-Term Trading Highlights

As noted in the introduction, 1Q20 saw significant market declines, with intermittent, yet limited market rebounds providing short term trading opportunities for experienced investors. This has continued in April, with the STI moving from a high of 2,481.44 on 1 April, to a low of 2,380.84 on 3 April, and then to a high of 2,571.89 on 7 April.

Aside for the multitude of investors who have added to long term positions amidst the recent declines, experienced active investors have seen enhanced risk-to-return of the STI stocks amidst the global volatility. The enhanced fluidity of trading conditions for STI stocks in 1Q20 are detailed in the table below.

Current STI Stocks Stock
Code
1Q20
VWAP
(S$)
1Q20
Amplitude
in bps
2H19
Amplitude
in bps
1Q20
Amplitude
in Ticks
2H19
  Amplitude
in Ticks
1Q20
Intraday 1-min
Volatility %
(Annualised)
2H19
Intraday 1-min
Volatility %
(Annualised)
YZJ Shipbldg SGD BS6 0.977 314 267 5 4 41.0 34.9
Mapletree Log Trust M44U 1.688 276 187 5 3 33.5 23.3
ThaiBev Y92 0.747 251 168 4 3 31.6 23.5
SPH T39 1.928 211 186 4 4 30.6 25.1
Sembcorp Ind U96 1.857 218 179 5 4 29.2 23.4
Genting Sing G13 0.776 223 115 4 2 28.8 19.1
CapitaCom Trust C61U 1.871 200 147 4 3 28.3 18.7
ComfortDelGro C52 1.952 231 167 5 4 28.2 21.2
CapitaMall Trust C38U 2.235 201 152 5 4 27.2 16.5
Wilmar Intl F34 3.75 243 160 10 6 26.3 19.7
JSH USD J37 37.481 160 128 69 56 26.2 20.3
Mapletree Com Trust N2IU 2.136 253 183 6 4 24.0 21.3
DairyFarm USD D01 6.577 170 135 12 12 23.3 19.8
JMH USD J36 73.592 141 132 109 104 22.9 20.5
Ascendas REIT A17U 3.015 182 130 6 4 22.3 15.3
SATS S58 3.943 203 121 10 6 22.3 14.8
CityDev C09 9.441 254 154 27 15 22.2 16.8
Venture V03 15.726 218 174 36 27 21.6 18.0
ST Engineering S63 3.781 210 127 9 5 21.4 16.6
Jardine C&C C07 24.778 187 161 50 51 20.9 17.8
UOL U14 7.384 219 136 16 10 20.8 16.5
HongkongLand USD H78 6.787 139 111 10 9 20.4 19.0
Singtel Z74 2.956 181 125 6 4 20.0 16.3
CapitaLand C31 3.447 181 117 7 4 19.9 15.7
SGX S68 8.708 181 122 16 10 19.2 14.1
SIA C6L 7.411 133 98 12 9 15.2 11.9
OCBC Bank O39 9.891 135 94 15 11 15.0 12.2
UOB U11 23.12 132 101 35 26 12.5 11.7
Keppel Corp BN4 5.932 89 107 6 7 12.0 13.7
DBS D05 22.209 122 101 31 25 11.5 10.7
Average 195 143 18 14 23.3 18.3

Source: SGX (Data as of 31 March 2020)


This article is provided by SGX My Gateway.


SGX My Gateway

SGX's investor education portal with market, product and investment information and events. Sign up now at sgx.com/mygateway to receive our investment updates and economic calendar.

This document is not intended for distribution to, or for use by or to be acted on by any person or entity located in any jurisdiction where such distribution, use or action would be contrary to applicable laws or regulations or would subject Singapore Exchange Limited (“SGX”) to any registration or licensing requirement. This document is not an offer or solicitation to buy or sell, nor financial advice or recommendation for any investment product. This document is for general circulation only. It does not address the specific investment objectives, financial situation or particular needs of any person. Advice should be sought from a financial adviser regarding the suitability of any investment product before investing or adopting any investment strategies. Use of and/or reliance on this document is entirely at the reader’s own risk. Further information on this investment product may be obtained from www.sgx.com. Investment products are subject to significant investment risks, including the possible loss of the principal amount invested. Past performance of investment products is not indicative of their future performance. Examples provided are for illustrative purposes only. While each of SGX and its affiliates (collectively, the SGX Group Companies) have taken reasonable care to ensure the accuracy and completeness of the information provided, each of the SGX Group Companies disclaims any and all guarantees, representations and warranties, expressed or implied, in relation to this document and shall not be responsible or liable (whether under contract, tort (including negligence) or otherwise) for any loss or damage of any kind (whether direct, indirect or consequential losses or other economic loss of any kind, including without limitation loss of profit, loss of reputation and loss of opportunity) suffered or incurred by any person due to any omission, error, inaccuracy, incompleteness, or otherwise, any reliance on such information, or arising from and/or in connection with this document. The information in this document may have been obtained via third party sources and which have not been independently verified by any SGX Group Company. No SGX Group Company endorses or shall be liable for the content of information provided by third parties. The SGX Group Companies may deal in investment products in the usual course of their business, and may be on the opposite side of any trades. SGX is an exempt financial adviser under the Financial Advisers Act (Cap. 110) of Singapore. The information in this document is subject to change without notice. This document shall not be reproduced, republished, uploaded, linked, posted, transmitted, adapted, copied, translated, modified, edited or otherwise displayed or distributed in any manner without SGX’s prior written consent.


SGX Stock / REIT Search

Advertisement

Trust Bank Referral Code

Advertisement