SGX Market Updates

Regional Value-Stocks Index Trading at Record Value


PUBLISHED ON |

11 March 2020

  • With a sharp 9% decline on Monday, the FTSE Value-Stocks ASEAN Index has declined 18% in the 2020 YTD, reducing its 3-year total return to a 3% decline. The first two sessions of this week saw the Index P/B ratio trade at 1.06x, a record low of since the Index launch in Nov 2013.

  • The 11 SGX-listed FTSE Value-Stocks ASEAN Index constituents were comparably more defensive with 13% YTD declines, bringing their average three year total return to 9%. With their marginal gains, Manulife REIT & Venture were amongst the Index’s five strongest stocks in 2020 YTD.

  • The FTSE Value-Stocks ASEAN Index consists of 50 stocks subject to Contrarian, Quality and Valuation screenings. Quality screening is applied to avoid value traps, based on Fundamental Factors such as 3-year ROE, Operating Profit Margin & Net Gearing.


From its 12 February high to the low on 10 March, the Dow Jones Industrial Average has generated a 19.9% decline. The shake-up in the US stock market, which account for two-fifths of the world’s market capitalitalsiation, has been mostly driven by COVID-19 developments and this week’s sharp adjustment to oil prices.

As markets adjust, and global policy makers respond and readjust mandates to support the economic impacts of containment and global quarantines, there have been a number of balanced moves in global markets.

The 2020 year through to 10 March has seen the Straits Times Index (“STI”) decline 11.9% and FTSE ASEAN All-Share Index decline 14.9%. Conversely, the safe-haven themed SPDR Gold ETF gained 12.9% with daily trading turnover in the SGX-listed ETF tripling its levels of 2019. With both the up and down moves, the STI 30 day historical volatility has returned to February 2016 levels, while the same volatility gauge for the regional FTSE ASEAN All-Share Index has returned to September 2015 levels.

After mostly performing in-line with global REITS in 2019, the 2020 year through to 10 March, has seen the S-REIT Sector outperform, with the iEdge S-REIT Index gaining 0.8% versus the median performance of the world’s 800 REITs at a decline of 6.2%. 


FTSE Value-Stocks ASEAN Index at Historically Low P/B Levels

For the three years going into March, the FTSE Value-Stocks ASEAN Index was amongst the 10 least performing Indices of some 40 thematically built regional equity indices published by FTSE Russell. Over the three years (which incorporates much of the full 2017 comparatively strong year), investors favored growth stocks over value stocks as demonstrated by regional growth indices well outpacing the value indices.  At times, however value stocks came into the spotlight, as we saw in the 2018 year when the FTSE Value-Stocks ASEAN Index was the second strongest of the suite of thematically built regional equity indices.

The FTSE Value-Stocks ASEAN Index consists of approximately 50 value stocks amongst the most liquid and tradable companies listed on Singapore Exchange, Indonesia Stock Exchange, Bursa Malaysia, Philippine Stock Exchange, and Stock Exchange of Thailand. The value-based methodology is designed by Value Partners Index Services Limited and the Index is calculated and maintained by FTSE Russell.

The FTSE Value-Stocks ASEAN Index has declined 7.4% over the first seven sessions of March, which has brought its 2020 year-to-date decline in total return to 18.1% , and its three year total return to a decline of 2.6% in SGD terms.

Moreover, this week has seen the FTSE Value-Stocks ASEAN Index Price-to-book ratio (P/B) ratio fall to 1.06x, a record low of since the Index was launched in November 2013. While the P/B ratio traded at lows on 9 March, the Index itself did not return to its January 2016 lows, August and September 2015 lows.


FTSE Value Stocks Index


Over the past three years the P/B ratio of the FTSE Value-Stocks ASEAN Index declined from 1.43x to 1.06x and averaged 1.46x over the entire three year period, which means the current P/B is a 27% discount to its three year average (in addition to a 27% discount to its five year average P/B).


FTSE Value-Stocks ASEAN Index Singapore Constituents

The 11 SGX-listed constituents of the FTSE Value-Stocks ASEAN Index have a combined market capitalisation of over S$222 billion, and include two of the FTSE Value-Stocks ASEAN Index’s strongest five stocks in the 2020 year through to 10 March, which were Manulife US REIT and Venture Corporation.

Current SGX-listed constituents of the
FTSE Value-Stocks ASEAN Index
SGX
Code
Mkt Cap
S$M
YTD Net
Institutional
Inflow
(S$M)
Div.
Yield
P/B
(x)
ROE YTD
Total
Return
%
3 Year
Total
Return
%
DBS GROUP HOLDINGS D05 $54,919 -$812 5.8% 1.06 13% -17% 31%
SINGAPORE TELECOMM Z74 $47,027 -$163 6.1% 1.75 10% -15% -14%
UNITED OVERSEAS BANK U11 $36,600 -$457 5.0% 0.90 11% -17% 16%
OVERSEA-CHINESE BANKING CORP O39 $42,770 -$209 5.5% 0.90 11% -11% 13%
GENTING SINGAPORE G13 $8,928 $3 4.8% 1.10 9% -20% -19%
COMFORTDELGRO CORP C52 $4,050 -$150 5.2% 1.60 10% -21% -15%
VENTURE CORP V03 $4,718 $62 4.3% 1.90 15% 1% 68%
SINGAPORE AIRLINES C6L $9,339 -$111 3.8% 0.80 5% -13% -13%
JARDINE CYCLE & CARRIAGE C07 $9,541 -$41 5.0% 1.00 14% -20% -40%
CDL HOSPITALITY TRUSTS J85 $1,578 -$26 5.3% 0.85 6% -17% 15%
MANULIFE US REAL ESTATE INV BTOU $2,177 $19 6.1% 1.20 4% 4% 56%
Average             -13% 9%

Source: SGX, StockFacts, Bloomberg , Thomson Reuters (Data as of 10 March 2020)


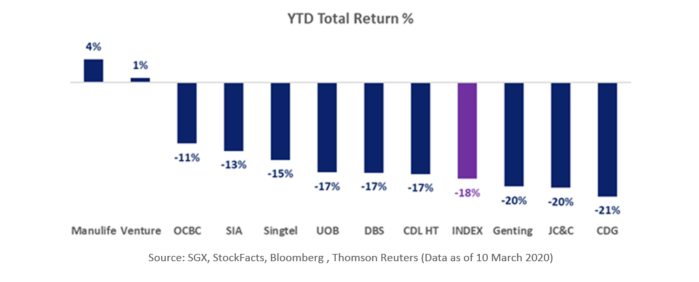
Together the 11 stocks account for 28% of the Index weightings as if the end of February 2020. The comparative average performances of the 11 stocks are illustrated below.


FTSE VALUE STOCKS YTD TOTAL RETURN


As a group the 11 stocks have contributed more than S$515 million a day to Singapore’s daily stock market turnover in the 2020 year through to 10 March. The 11 stocks have averaged a 13.3% decline in the 2020 year-to date compared to the 18.1% decline of the Index.  As illustrated below, four stocks maintain a P/B ratio below the Index P/B and five stocks maintain a higher Return on Equity than the Index.


FTSE VALUE STOCKS ROE AND PB


Singapore’s Previous FTSE Value-Stocks ASEAN Index Constituents Also Defensive in YTD

On 21 October 2019, Singapore Airlines, ComfortDelGro and CDL Hospitality Trusts were added to the FTSE Value-Stocks ASEAN Index, while City Developments, UOL Group, Mapletree Industrial Trust and Bukit Sembawang were removed from the Index.

City Developments, UOL Group, Mapletree Industrial Trust and Bukit Sembawang have averaged a 7% decline in total return in the 2020 year to 10 March, with an average total return of 22% over the past three years. While City Developments declined as much as the FTSE Value-Stocks ASEAN Index in the 2020 year through to 10 March, the remaining three stocks all outperformed. Returns were led by Mapletree Industrial Trust which is now the largest stock by market capitalisation on the STI Reserve List.

Previous SGX-listed constituents of the
FTSE Value-Stocks ASEAN Index
omitted in Oct 2019
SGX
Code
Mkt Cap
S$M
YTD Net
Institutional
Inflow
(S$M)
Div.
Yield
P/B
(x)
ROE YTD
Total
Return
%
3 Year
Total
Return
%
UOL GROUP U14 $5,871 -$10 2.6% 0.60 5% -16% 7%
BUKIT SEMBAWANG ESTATES B61 $1,100 -$1 0.9% 0.80 8% -9% -23%
CITY DEVELOPMENTS C09 $8,135 -$40 1.6% 0.80 6% -18% -7%
MAPLETREE INDUSTRIAL TRUST ME8U $6,559 $36 3.5% 1.90 9% 16% 112%
Average             -7% 22%

Source: SGX, StockFacts, Bloomberg , Thomson Reuters (Data as of 10 March 2020)


Note that the Index reviews are conducted on a semi-annual basis in May and October using data as at the last working day in April and September respectively. The full list of index constituents can be found here.


FTSE Value-Stocks ASEAN Index Methodology

Each security must be a current constituent of the FTSE Global All Cap Index. In the Index screening, Value Partners will screen each security in the ASEAN Investable Universe, and each will be ranked by three sets of value-investing screening criteria, namely ContrarianQuality and Valuation screenings. The largest capitalised stocks that meet the criteria will be selected.

As outlined in the Index ground rules:

  • Contrarian screening aims to avoid following the herd. Companies in the investable universe covered by more than 10 analysts in the forecast recommendation with a buy recommendation from over 80% of analysts will be screened out.

  • Quality screening is applied to avoid value traps, based on three fundamental factors: 3-year Average Return on Equity, Operating Profit Margin and Net Gearing.

  • Valuation screening helps to identify relatively under-valued constituents in the ASEAN Investable Universe with rankings based on Dividend Yield and Forecast Price-to-Earnings (P/E) ratio.


From the ASEAN Investable Universe, the companies passing through these screenings are ranked by P/E ratio and the companies with the lowest PE ratios are selected to be the constituents of the Index. The Index is free float-weighted and constituent stocks are capped at 5% weighting to avoid over-concentration in any one stock.Reviews will be conducted on a semi-annual basis in May and October using data as at the last working day in April and September respectively.

For more details on index methodology, click here


This article is provided by SGX My Gateway.


SGX My Gateway

SGX's investor education portal with market, product and investment information and events. Sign up now at sgx.com/mygateway to receive our investment updates and economic calendar.

This document is not intended for distribution to, or for use by or to be acted on by any person or entity located in any jurisdiction where such distribution, use or action would be contrary to applicable laws or regulations or would subject Singapore Exchange Limited (“SGX”) to any registration or licensing requirement. This document is not an offer or solicitation to buy or sell, nor financial advice or recommendation for any investment product. This document is for general circulation only. It does not address the specific investment objectives, financial situation or particular needs of any person. Advice should be sought from a financial adviser regarding the suitability of any investment product before investing or adopting any investment strategies. Use of and/or reliance on this document is entirely at the reader’s own risk. Further information on this investment product may be obtained from www.sgx.com. Investment products are subject to significant investment risks, including the possible loss of the principal amount invested. Past performance of investment products is not indicative of their future performance. Examples provided are for illustrative purposes only. While each of SGX and its affiliates (collectively, the SGX Group Companies) have taken reasonable care to ensure the accuracy and completeness of the information provided, each of the SGX Group Companies disclaims any and all guarantees, representations and warranties, expressed or implied, in relation to this document and shall not be responsible or liable (whether under contract, tort (including negligence) or otherwise) for any loss or damage of any kind (whether direct, indirect or consequential losses or other economic loss of any kind, including without limitation loss of profit, loss of reputation and loss of opportunity) suffered or incurred by any person due to any omission, error, inaccuracy, incompleteness, or otherwise, any reliance on such information, or arising from and/or in connection with this document. The information in this document may have been obtained via third party sources and which have not been independently verified by any SGX Group Company. No SGX Group Company endorses or shall be liable for the content of information provided by third parties. The SGX Group Companies may deal in investment products in the usual course of their business, and may be on the opposite side of any trades. SGX is an exempt financial adviser under the Financial Advisers Act (Cap. 110) of Singapore. The information in this document is subject to change without notice. This document shall not be reproduced, republished, uploaded, linked, posted, transmitted, adapted, copied, translated, modified, edited or otherwise displayed or distributed in any manner without SGX’s prior written consent.


SGX Stock / REIT Search

Advertisement

Trust Bank Referral Code

Advertisement