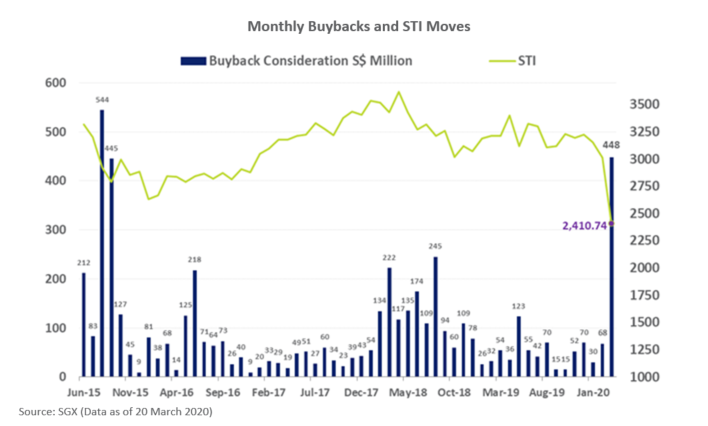
In the month of March (through to 20 Mar), 53 SGX primary-listed stocks bought back shares for a total consideration of S$448 million. This has brought the consideration for the month to date to the highest level since S$544 million in consideration for the month of August 2015.
In the 2020 year to 20 Mar, ASEAN’s most defensive sectors were Utilities & Healthcare while Technology & Energy saw the most declines; the STI performed in line with its regional peers with a price decline of 25.2% compared to a 28.3% decline for major ASEAN indices.
The regional declines have seen more impact to large cap stocks than small cap stocks. The top quartile of ASEAN stocks by market value generated a median decline of 26% in the 2020 year to 20 Mar, while the next quartile by market value generated a 21% median decline.
Total share buyback consideration for month of March (through to 20 Mar), has surged to S$448 million, which represents a 55 month high since S$544 million was reported for buyback consideration in August 2015. This has brought the total consideration of share buybacks for SGX primary-listed stocks to S$546 million in the 2020 year to 20 March, close to the S$590 million in consideration for the entire calendar year of 2019 (see recent SGX market update: 16 Companies Stocks Bought Back S$30 Million in Shares in January).
As of the Friday 20 March close, the Straits Times Index (STI) had declined 20% in the month to 2,410.74. The STI 30 day volatility also climbed to 35.2% on 20 March, the highest level it has seen since June 2009. This has brought the STI’s price decline to 25.2% for the 2020 year through to 20 March, in-line with the 28.3% average decline for major ASEAN indices that include the Jakarta Composite Index, FTSE Bursa Malaysia KLCI, and the Stock Exchange of Thailand Index.
Regional Moves Beyond the Benchmarks
Across the ASEAN stock markets, the most defensive sectors have been the Utilities and Healthcare sectors, while the Technology and Energy Sectors have been the most effected by the sharp increase in global volatility. Amongst the many informative websites on COVID-19 developments, live updates on ASEAN economies can be found at ASEAN Briefing here.
The global declines have had more of an impact on regional large-cap stocks over small-cap stocks. While the top quartile of ASEAN stocks by market value have generated a median decline of 26% in the 2020 year though to 20 March, the next quartile of ASEAN stocks by market value generated a 21% median decline. The lowermost 50% of ASEAN stocks by market value have generated a median decline of 18%. The median decline for ASEAN stocks in the 2020 year through to 20 March was 23%.
On fundamental factor basis, the quartile of ASEAN stocks with the highest Return on Equity, have generated a median decline of 20% in the 2020 year through to 20 March, as have the quartile of stocks with the highest cash flow to total liabilities ratio, while the quartile of stocks with the lowest total debt to total assets ratio generated a median decline of 19%. Similarly, the more than three-fifths of the stocks listed across ASEAN exchanges that report all their revenue within ASEAN have also generated a median decline of 19%.
March 2020 Buybacks (MTD through to 20 March) at S$448 Million
A total of 53 primary-listed stocks conducted buybacks in Singapore in the first three weeks of March, up significantly from 16 stocks in January and 17 stocks in February. Share buyback transactions involve share issuers repurchasing some of their outstanding shares from shareholders through the open market.
Once the shares are bought back, they can be converted into treasury shares, which means they are no longer categorised as shares outstanding. Motivations for share buybacks can include employee compensation plans (such as share option schemes or employee share purchase plans) or long term capital management. Buybacks can pick up amidst market declines that are driven by broader moves on international macroeconomic developments as seen in the month-to-date and in August and September 2015, when the STI declined 13% for two months, buybacks surged to close to S$1 billion.
The table below summarises the buyback considerations in March 2020 through to March 20. The table is sorted by the value of the total consideration amount for the month, which combines the amount of shares or units purchased and the purchasing price of the transactions.
SGX primary-listed stocks that conducted buybacks in the March 2020 month through to 20 March |
Number of Shares/units Authorised for Purchase in Current Mandate |
Total Number of Shares/units Purchased in March 2020 to 20 March |
Total Buyback Consideration (including stamp duties, clearing changes etc.) paid or payable for the shares |
Average Price Paid Per Share/Unit (including stamp duties, clearing changes etc.) |
Cumulative Number of Shares/units purchased in Mandate to date |
---|---|---|---|---|---|
DBS GROUP HOLDINGS | 51,165,438 | 18,450,000 | $368,015,896 | $19.947 | 24,350,000 |
OVERSEA-CHINESE BANKING CORPORATION | 212,257,935 | 2,100,000 | $19,232,658 | $9.158 | 13,480,000 |
UNITED OVERSEAS BANK | 83,287,115 | 792,000 | $16,234,086 | $20.498 | 792,000 |
GOLDEN AGRI-RESOURCES | 1,273,475,615 | 42,683,100 | $8,063,785 | $0.189 | 42,683,100 |
SINGAPORE EXCHANGE | 107,164,240 | 495,300 | $4,205,116 | $8.490 | 880,800 |
OXLEY HOLDINGS | 207,787,184 | 15,190,300 | $3,168,050 | $0.209 | 12,190,300 |
SILVERLAKE AXIS | 264,505,273 | 11,010,100 | $3,094,730 | $0.281 | 45,839,400 |
BOUSTEAD SINGAPORE | 48,968,653 | 3,768,400 | $2,435,081 | $0.646 | 7,392,300 |
SINGAPORE TECHNOLOGIES ENGINEERING | 62,432,801 | 500,000 | $1,936,483 | $3.873 | 7,799,100 |
FIRST RESOURCES | 158,407,296 | 1,388,500 | $1,934,153 | $1.393 | 1,388,500 |
GLOBAL INVESTMENTS | 168,741,864 | 14,364,600 | $1,828,807 | $0.127 | 90,443,800 |
AEM HOLDINGS | 27,096,300 | 1,100,000 | $1,804,092 | $1.640 | 2,600,000 |
SINGAPORE SHIPPING CORPORATION | 42,417,689 | 6,637,400 | $1,736,063 | $0.262 | 24,131,600 |
UMS HOLDINGS | 53,642,957 | 2,000,000 | $1,348,377 | $0.674 | 2,000,000 |
SINGAPORE REINSURANCE CORPORATION | 60,521,978 | 4,011,700 | $1,092,109 | $0.272 | 4,011,700 |
HONG FOK CORPORATION | 86,147,124 | 1,733,300 | $945,927 | $0.546 | 4,088,600 |
HRNETGROUP | 100,581,957 | 2,050,000 | $940,078 | $0.459 | 2,622,000 |
BUMITAMA AGRI | 173,749,704 | 2,107,800 | $800,168 | $0.380 | 2,107,800 |
KSH HOLDINGS | 56,813,564 | 2,366,700 | $702,678 | $0.297 | 2,366,700 |
STAMFORD LAND CORPORATION | 81,973,408 | 1,483,900 | $609,392 | $0.411 | 36,751,700 |
HOTEL PROPERTIES | 26,914,011 | 198,300 | $593,635 | $2.994 | 454,500 |
THE HOUR GLASS | 70,501,188 | 990,000 | $561,410 | $0.567 | 1,020,000 |
OUE | 90,151,586 | 444,200 | $561,023 | $1.263 | 444,200 |
CHINA SUNSINE CHEMICAL HOLDINGS | 98,262,340 | 1,829,600 | $541,874 | $0.296 | 8,810,300 |
NAM LEE PRESSED METAL INDUSTRIES | 24,374,408 | 1,587,700 | $502,376 | $0.316 | 1,587,700 |
SINGHAIYI GROUP | 421,905,217 | 6,716,700 | $476,466 | $0.071 | 7,026,700 |
PACIFIC CENTURY REGIONAL DEVELOP. | 264,974,030 | 1,561,500 | $452,561 | $0.290 | 1,561,500 |
GRP | 18,789,481 | 2,693,100 | $441,633 | $0.164 | 2,693,100 |
COMFORTDELGRO CORPORATION | 216,638,866 | 255,000 | $399,587 | $1.567 | 255,000 |
Q & M DENTAL GROUP (SINGAPORE) | 78,562,192 | 990,000 | $374,688 | $0.378 | 990,000 |
ST GROUP FOOD INDUSTRIES HOLDINGS | 24,600,000 | 1,535,600 | $367,039 | $0.239 | 2,981,400 |
THE STRAITS TRADING COMPANY | 40,767,817 | 165,900 | $307,302 | $1.852 | 737,600 |
FOOD EMPIRE HOLDINGS | 53,426,699 | 600,000 | $306,950 | $0.512 | 1,024,500 |
JAPFA | 186,466,879 | 587,400 | $266,048 | $0.453 | 1,917,900 |
NORDIC GROUP | 39,251,910 | 1,122,600 | $255,080 | $0.227 | 1,738,200 |
GSH CORPORATION | 195,893,335 | 945,100 | $236,629 | $0.250 | 945,100 |
TUAN SING HOLDINGS | 118,620,496 | 787,800 | $194,292 | $0.247 | 5,241,800 |
TELECHOICE INTERNATIONAL | 45,438,718 | 850,000 | $164,880 | $0.194 | 4,450,000 |
GKE CORPORATION | 78,853,189 | 3,112,300 | $162,566 | $0.052 | 3,112,300 |
JUMBO GROUP | 64,068,820 | 604,300 | $132,843 | $0.220 | 604,300 |
AMPLEFIELD | 90,061,753 | 2,500,000 | $88,359 | $0.035 | 2,500,000 |
CDW HOLDING | 22,724,200 | 500,000 | $85,470 | $0.171 | 5,205,500 |
SINGAPORE MEDICAL GROUP | 48,072,163 | 445,000 | $84,486 | $0.190 | 584,000 |
KIMLY | 114,890,293 | 460,000 | $82,890 | $0.180 | 460,000 |
ISOTEAM | 28,506,812 | 400,000 | $70,417 | $0.176 | 400,000 |
OKP HOLDINGS | 30,843,059 | 370,000 | $56,260 | $0.152 | 370,000 |
SINARMAS LAND | 425,586,249 | 224,500 | $34,408 | $0.153 | 224,500 |
JAPAN FOODS HOLDING | 17,360,290 | 85,700 | $24,997 | $0.292 | 85,700 |
GOODLAND GROUP | 36,020,991 | 90,000 | $14,845 | $0.165 | 190,000 |
KIM HENG OFFSHORE & MARINE HOLDINGS | 70,883,230 | 475,000 | $10,729 | $0.023 | 625,000 |
KODA | 8,251,362 | 20,000 | $10,034 | $0.502 | 20,000 |
SHS HOLDINGS | 68,512,981 | 50,000 | $8,147 | $0.163 | 50,000 |
MTQ CORPORATION | 21,631,848 | 37,300 | $7,074 | $0.190 | 37,300 |
Total | 167,467,700 | $448,004,724 |
The date of the relevant share buyback mandate is also provided in the table above, in addition to the amount of shares authorised to be bought back under the mandate. The total number of shares purchased under the mandate and the percentage of the companies that issued shares that have been repurchased under the mandate are also provided.
Share buyback information can be found on the company disclosure page on the SGX website, using the Announcement category and sub-category of Share Buy Back-On Market. As best practice, companies should refrain from buying back their shares during the two weeks immediately before its quarterly financial statements and one month immediately before the full-year financial statements.