SGX Market Updates

Singapore Stocks that Beat the STI in 2019 YTD


PUBLISHED ON |

17 December 2019

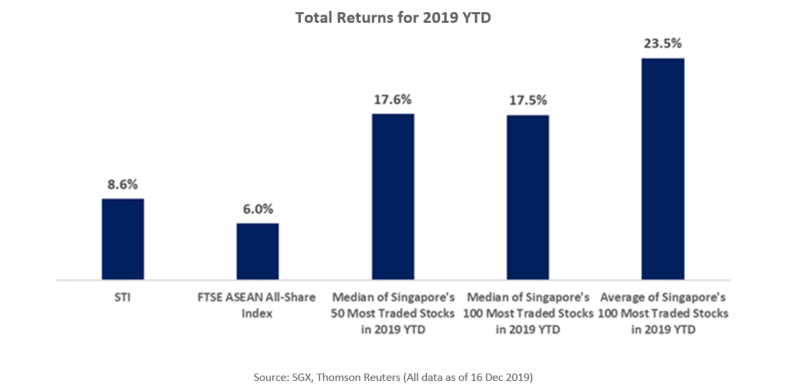
  • While the STI has generated an 8.6% total return in 2019 YTD, two-thirds of Singapore’s 100 most actively traded stocks by turnover outpaced the benchmark with total returns above 8.6%. The 100 stocks on a whole, generated a median total return of 17.5% and average total return of 23.5%.

  • Net institutional inflows were led by five STI stocks: SingTel, SGX, Wilmar Intl, CapitaLand and ThaiBev, which averaged total returns of 32%. The Consumer Goods Sector accounted for two of these stocks, with the Sector also largely attributing to last month’s expansion in the Global Manufacturing PMI.

  • A cautious macro outlook carries into 2020, with the global GDP growth forecast to pick up to 3.4%, following a possible 10 year low of 3.0% in 2019. Key drivers into 2020 remain changing consumer markets, technology growth, low interest rates, and from a micro perspective, agility and adaptability.


The STI has generated an 8.6% total return in the 2019 year-to-date, in-line with its 9.2% average annualised total return for the preceding 10 years going into 2019. For much of the year, the US Dollar Index continued to built on its gains in 2018, which coincided with the regional FTSE ASEAN All-Share Index generating a 6.0% total return in the 2019 year-to-date. 

As a group, Singapore’s 100 most actively traded stocks by turnover outpaced the STI benchmark with a median total return of 17.5% and average total return of 23.5%. The 100 stocks were also the combined recipient of S$1.1 billion in net institutional inflows. Exactly two-thirds of the 100 stocks, outpaced the STI in the year-to-date with total returns above 8.6%.


Total Returns for 2019 YTD


Global Manufacturing PMI Underpins Current 2020 Outlooks

The above returns have corresponded with the global GDP growth forecast by the IMF to be at 3.0% in 2019. This represents a 10-year low, which is expected to pick up to 3.4% in 2020. In Singapore, the MAS Economic Policy Group expect the Singapore economy to grow by 0.5% to 1.0% in 2019 and pick up modestly in 2020 to 0.5% to 2.5%. This is alongside a projected recovery in the global electronics cycle.

Last month, the global manufacturing JP Morgan Global Manufacturing PMI edged back into expansion territory, to 50.3, after spending the preceding six months in contraction. While the report maintained that last month’s PMI recovery was centered on the Consumed Goods sector, there have been other anecdotal signs of recovery in technology-related clusters:

  • UMS Executive Chairman and CEO Andy Luong noted in Nov that there were signs of an upturn in the overall semiconductor industry as demand is picking up, with chip inventories easing, and new technological disruptors driving the growth of new products and capabilities.

  • Also in Nov, Frencken Group expressed some confidence that in the long term the global technology sector will continue to benefit from the positive market trends in cloud computing, big data, artificial intelligence, the Internet of Things and life sciences.

In addition, continuous digitalisation efforts and cloud deployments have supported Data Centre expansions across the world in 2019. On Sep 16, Keppel DC REIT launched a private placement to fund Data Centre acquisitions which was fully covered within the first hour of bookbuilding, and ended being nine times covered. Prior to this, Equinix Inc, had led the returns of the world’s largest 100 REITs by market value, and outpaced Keppel DC REIT in 2019 returns by 16%. Since then, Singapore’s largest Data Centre REIT has caught up with the world’s largest Data Centre REIT, with both stocks generating 60% year-to-date total returns.


Expansions in 2019

Before the market can focus on Phase 2 of the US-China trade deal, implementation of Phase 1 will be watched closely. While most of 2019 saw uncertainty on a US-China trade resolution, there were reports manufacturing and/or international companies were exploring new initiatives to offset that uncertainty. For instance, Valuetronics Holdings noted that in anticipation of customers changing needs in a challenging environment, the Group had in early 2019 embarked on an expansion plan to expand its manufacturing footprint to Vietnam to provide customers with an alternate manufacturing platform outside China. The Group’s first leased manufacturing facility in Vietnam had begun mass production in June 2019 and shipments have since been made from Vietnam to the US market.

Hence while a cautious macro outlook carries over into 2020, this past year saw plenty of sub-themes, such as changing consumer markets, technology driven growth, low interest rates which had varied impact on different market segments. From a micro viewpoint, business agility, adaptability and operational efficiency remained key business drivers.

At the same time, headline growth outlooks have become increasingly synchronous, particularly across large or open economies with strong global links through financial services, technology, trade and logistics. This means that key economic developments and big policy measures to support growth, such as accommodative Federal Reserve measures or China’s counter-cyclical measures, did see similar market impacts across much of the globe.

Globally, REITs outpaced Banks with the lower interest rate outlook for much of 2019. The median total return of all REITs listed across the was 18% (with average total return of 20%) as of Dec 16. In Singapore, the iEdge SREIT Index generated a 24.8% total return.

Beyond the performances, portfolio acquisitions have seen Singapore REITs and Property Trusts raise a record S$7.7 billion in secondary fundraising in the 2019 year-to-date, up from the previous record of S$4.3 billion in 2018. This includes the Keppel DC REIT private placement discussed above. 3 of the 4 REITs that listed on SGX this year have also ranked amongst ASEAN’s 5 largest IPOs in 2019 by deal size.


Comparative Performances

Net institutional inflows totalled S$1.1 billion in the 2019 year-to-date and were led by 5 STI stocks: SingTel, SGX, Wilmar International, CapitaLand and Thai Beverage, which averaged total returns of 32%.  The 100 most traded stock by turnover in the 2019 year-to-date are tabled below, with the table ranked in order of turnover.

As discussed above the median return of the 100 most traded stocks by turnover was approximately double the return of the STI over the period and as many as two-thirds of the 100 stocks individually outpaced the STI. Of the 100 stocks, the 10 strongest performances in the 2019 year-to-date were generated by non-STI stocks that included Global Invacom Group, Catalist-Listed Rex International Holding, AEM Holdings, Frencken Group, Sunpower Group, UMS Holdings, Hi-P International, Keppel DC REIT, Ascendas Hospitality Trust and Sasseur REIT.

Stock Name SGX
Code
Mkt Cap
S$M
YTD Total
Return
(SGD)
12M Historical
Volatility
%
Average Daily
Turnover in 2019
(S$M)
Net
Institutional
Inflow
(S$M)
DBS GROUP HOLDINGS D05 65,641 15 16 101.9 -218
SINGAPORE TELECOMMUNICATIONS Z74 55,029 19 16 68.3 601
UNITED OVERSEAS BANK U11 44,077 13 16 61.6 -129
OVERSEA-CHINESE BANKING CORP O39 48,028 1 14 56.5 -229
ASCENDAS REAL ESTATE INV TRT A17U 10,507 22 15 35.7 -27
YANGZIJIANG SHIPBUILDING BS6 4,311 -9 45 34.4 27
CAPITALAND C31 18,556 22 16 25.8 201
CAPITALAND MALL TRUST C38U 8,890 11 17 25.7 -44
GENTING SINGAPORE G13 11,153 -2 20 25.6 -151
CAPITALAND COMMERCIAL TRUST C61U 7,600 18 16 25.0 40
MAPLETREE COMMERCIAL TRUST N2IU 7,506 45 20 23.6 -14
SINGAPORE EXCHANGE S68 9,585 30 17 23.2 458
KEPPEL CORP BN4 12,206 18 21 22.2 -52
VENTURE CORP V03 4,733 23 31 20.4 -1
WILMAR INTERNATIONAL F34 26,059 35 19 20.2 243
JARDINE MATHESON HLDGS J36 54,515 -20 25 20.0 -18
HONGKONG LAND HOLDINGS H78 17,880 -9 24 20.0 -102
MAPLETREE LOGISTICS TRUST M44U 6,379 41 18 18.8 32
COMFORTDELGRO CORP C52 5,241 17 21 18.3 78
SINGAPORE TECH ENGINEERING S63 12,311 18 17 17.0 171
SUNTEC REIT T82U 5,070 7 15 16.5 -55
CITY DEVELOPMENTS C09 9,795 36 20 16.4 117
THAI BEVERAGE PCL Y92 22,728 52 29 15.3 194
MAPLETREE NORTH ASIA COMMERCIAL RW0U 3,642 6 21 12.3 -32
JARDINE STRATEGIC HLDGS J37 46,503 -15 24 12.3 1
MAPLETREE INDUSTRIAL TRUST ME8U 5,502 38 16 11.4 14
SINGAPORE AIRLINES C6L 10,808 0 13 11.1 -55
JARDINE CYCLE & CARRIAGE C07 12,078 -10 23 10.9 -23
AEM HOLDINGS AWX 518 142 45 10.5 65
SINGAPORE PRESS HOLDINGS T39 3,349 -6 21 10.5 4
SATS S58 5,703 14 16 8.8 28
KEPPEL DC REIT AJBU 3,277 60 21 8.8 1
UOL GROUP U14 6,789 33 18 8.7 105
FRASERS LOGISTICS & INDUSTRI BUOU 2,688 23 20 8.4 24
KEPPEL REIT K71U 4,144 13 15 8.4 42
SEMBCORP INDUSTRIES U96 3,982 -11 23 8.2 -94
SEMBCORP MARINE S51 2,678 -17 33 8.0 -58
NETLINK NBN TRUST CJLU 3,644 29 13 7.9 -18
HI-P INTERNATIONAL H17 1,240 80 52 7.1 31
DAIRY FARM INTL HLDGS D01 10,738 -34 27 6.7 -34
GOLDEN AGRI-RESOURCES E5H 2,738 -10 45 6.4 -9
FRASERS CENTREPOINT TRUST J69U 2,984 29 18 5.9 10
ASCOTT RESIDENCE TRUST A68U 2,920 32 15 5.1 68
REX INTERNATIONAL HOLDING 5WH 245 242 67 4.6 2
STARHUB CC3 2,459 -13 24 4.1 -91
KEPPEL INFRASTRUCTURE TRUST A7RU 2,722 22 17 3.9 1
FRASERS COMMERCIAL TRUST ND8U 1,491 27 18 3.8 17
CDL HOSPITALITY TRUSTS J85 1,952 17 15 3.3 -12
ESR-REIT J91U 1,866 13 19 3.3 16
CAPITALAND RETAIL CHINA TRUS AU8U 1,898 25 17 3.1 -4
UMS HOLDINGS 558 531 83 34 3.0 48
SINGAPORE POST S08 2,093 5 15 2.8 11
UNITED ENGINEERS U04 1,715 8 11 2.7 38
EAGLE HOSPITALITY TRUST LIW 631 -33 40 2.6 -81
YANLORD LAND GROUP Z25 2,260 1 29 2.5 -16
MANULIFE US REAL ESTATE INV BTOU 2,125 41 16 2.5 4
CROMWELL EUROPEAN REIT CNNU 2,000 23 21 2.2 -23
AIMS APAC REIT O5RU 983 14 15 2.0 -16
HUTCHISON PORT HOLDINGS TR-U NS8U 1,982 -26 30 1.9 -4
FIRST REAL ESTATE INVT TRUST AW9U 794 10 19 1.9 -81
VALUETRONICS HOLDINGS BN2 359 33 26 1.9 5
ASCENDAS INDIA TRUST CY6U 1,749 51 23 1.7 -6
STARHILL GLOBAL REIT P40U 1,583 13 14 1.7 29
SHENG SIONG GROUP OV8 1,879 22 15 1.7 23
FIRST RESOURCES EB5 2,962 23 26 1.7 13
ASCENDAS HOSPITALITY TRUST Q1P 1,275 54 17 1.6 47
PARKWAYLIFE REAL ESTATE C2PU 1,948 28 14 1.6 12
SIA ENGINEERING CO S59 3,170 30 21 1.5 -6
SPH REIT SK6U 2,948 14 14 1.5 -12
LENDLEASE GLOBAL COMMERCIAL JYEU 1,086 6 17 1.5 -34
FAR EAST HOSPITALITY TRUST Q5T 1,389 25 17 1.4 7
FRENCKEN GROUP E28 395 129 42 1.4 23
JAPFA UD2 1,071 -19 36 1.4 -19
CACHE LOGISTICS TRUST K2LU 768 10 17 1.4 1
SASSEUR REAL ESTATE INVESTME CRPU 1,071 53 18 1.2 -23
RAFFLES MEDICAL GROUP BSL 1,791 -9 17 1.2 -21
KEPPEL PACIFIC OAK US REIT CMOU 981 39 17 1.1 -9
ASIAN PAY TELEVISION TRUST S7OU 243 43 39 1.0 -1
YOMA STRATEGIC HLDGS Z59 781 3 38 1.0 3
OLAM INTERNATIONAL O32 5,640 12 22 1.0 13
SUNPOWER GROUP 5GD 494 89 49 1.0 19
COSCO SHIPPING INTERNATIONAL F83 705 -5 33 1.0 9
SILVERLAKE AXIS 5CP 1,081 3 29 1.0 -13
CITIC ENVIROTECH CEE 1,314 45 58 1.0 8
GLOBAL INVACOM GROUP QS9 42 340 130 1.0 1
CHINA AVIATION OIL SINGAPORE G92 1,075 22 26 0.9 -5
OUE COMMERCIAL REIT TS0U 2,989 29 18 0.9 35
HAW PAR CORP H02 2,851 16 17 0.9 -9
SYNAGIE CORP V2Y 28 -33 104 0.8 -3
CREATIVE TECHNOLOGY C76 224 -21 58 0.8 -3
OXLEY HOLDINGS 5UX 1,496 28 30 0.8 1
TEE INTERNATIONAL M1Z 38 -60 75 0.8 -1
KOUFU GROUP VL6 427 29 22 0.8 20
CHINA EVERBRIGHT WATER U9E 915 10 48 0.8 -8
THOMSON MEDICAL GROUP A50 1,586 -18 28 0.8 14
YING LI INTERNATIONAL 5DM 258 -13 32 0.8 13
CSE GLOBAL 544 277 52 29 0.7 -6
CHIP ENG SENG CORP C29 477 -3 19 0.7 -12
WING TAI HOLDINGS W05 1,530 6 12 0.7 -9
EC WORLD REIT BWCU 609 19 13 0.7 -34
Average:     23.5 26.3    
Median:     17.5 20.2    

Source: SGX, Thomson Reuters (All data as of 16 Dec 2019)
^ denotes SGX Watch-list, in the case of Global Invacom the stock joined the Watch-List under the Minimum Trading Price (“MTP”) Entry Criteria in June 2018


This article is provided by SGX My Gateway.


SGX My Gateway

SGX's investor education portal with market, product and investment information and events. Sign up now at sgx.com/mygateway to receive our investment updates and economic calendar.

This document is not intended for distribution to, or for use by or to be acted on by any person or entity located in any jurisdiction where such distribution, use or action would be contrary to applicable laws or regulations or would subject Singapore Exchange Limited (“SGX”) to any registration or licensing requirement. This document is not an offer or solicitation to buy or sell, nor financial advice or recommendation for any investment product. This document is for general circulation only. It does not address the specific investment objectives, financial situation or particular needs of any person. Advice should be sought from a financial adviser regarding the suitability of any investment product before investing or adopting any investment strategies. Use of and/or reliance on this document is entirely at the reader’s own risk. Further information on this investment product may be obtained from www.sgx.com. Investment products are subject to significant investment risks, including the possible loss of the principal amount invested. Past performance of investment products is not indicative of their future performance. Examples provided are for illustrative purposes only. While each of SGX and its affiliates (collectively, the SGX Group Companies) have taken reasonable care to ensure the accuracy and completeness of the information provided, each of the SGX Group Companies disclaims any and all guarantees, representations and warranties, expressed or implied, in relation to this document and shall not be responsible or liable (whether under contract, tort (including negligence) or otherwise) for any loss or damage of any kind (whether direct, indirect or consequential losses or other economic loss of any kind, including without limitation loss of profit, loss of reputation and loss of opportunity) suffered or incurred by any person due to any omission, error, inaccuracy, incompleteness, or otherwise, any reliance on such information, or arising from and/or in connection with this document. The information in this document may have been obtained via third party sources and which have not been independently verified by any SGX Group Company. No SGX Group Company endorses or shall be liable for the content of information provided by third parties. The SGX Group Companies may deal in investment products in the usual course of their business, and may be on the opposite side of any trades. SGX is an exempt financial adviser under the Financial Advisers Act (Cap. 110) of Singapore. The information in this document is subject to change without notice. This document shall not be reproduced, republished, uploaded, linked, posted, transmitted, adapted, copied, translated, modified, edited or otherwise displayed or distributed in any manner without SGX’s prior written consent.


SGX Stock / REIT Search

Advertisement

Trust Bank God Of Fortune Referral Code PGKPSWAE Trust Bank Referral Code 🎁

Advertisement