SGX Market Updates

Equities Bucked October Effect, The Straits Times Index STI Posted 4% Rebound


PUBLISHED ON |

04 November 2019

  • With the resumption of trading after a weeklong national holiday in China and the tentative agreement for the Phase 1 Trade Deal announced, investors rotated from treasuries to equities, with emerging markets benefiting from a decline in the US Dollar.

  • The STI gained 4% in October, taking the 10 month total return of the STI to 9%, in-line with its 10 year average annualised total return going into 2019. The STI’s top performing stocks in October were Keppel Corp, Sembcorp Industries, CDL, Jardine C&C and Genting.

  • Singapore’s 50 most traded stocks by turnover in October, also averaged 4% gains in October, driving their average 10 month total return to a comparatively stronger 20%. The 50 stocks were recipient to a combined net institutional inflow of S$79 million for the month.


Like the sell in May adage, the October effect is popular amongst calendar observers as the month corresponded with the historical market declines of 1929, 1987 and 2008. As discussed here, the effect is more psychological than evidential. And contrary to the adage, equity benchmarks gained across most countries in October 2019, benefitting from rotation out of global bond markets matched by declines in the US Dollar. The key market drivers were as follows:

  • Once the China stock market re-opened following the week long national holiday, its local markets had time to digest its positive manufacturing gauges for the month of September. Coupled with US President Trump announcing the United States and China had reached a tentative agreement for the "first phase" of a trade deal on Oct 11, the 10 year UST yields bounced from 1.50% lows in the first week of October to end the month at 1.69%.

  • This also saw the trade-weighted US Dollar Index decline 2% and the FTSE All World Index gain 5% over the same three weeks. Singapore’s benchmark, the Straits Times Index (“STI”) also saw a 5% bounce from its October intra-month low of 3071.54 to end October at 3229.8.

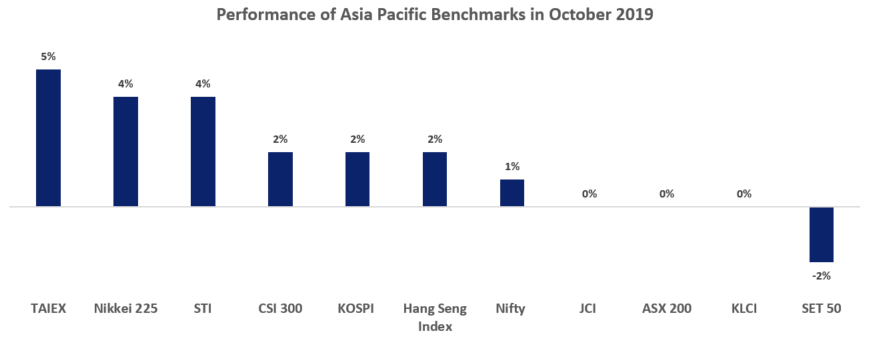
  • For the month in its entirety, the STI gained 4% in October, bringing its 10 month total return in-line with its longer term 10 year average annualised 9%. On par with the 4% return of the Nikkei 225, the two indices were the second best performers across Asia Pacific for the month of October, with Taiwan’s technology-laden TAIEX leading the region on 5% gains.


Asia Pacific Stock Market Benchmarks Performance October 2019

Source: SGX, Refinitiv, Bloomberg (Data as of 31 October 2019) 


With the aforementioned key developments, it was no surprise that emerging markets outperformed developed markets over the month. Moreover, hi-tech hardware stocks which have been impacted by the adverse side of the US-China trade war as much as any industry, outpaced the broader benchmarks.


Singapore Hi-Tech Stocks Posted Strong Recovery in October

Aside from the broad market drivers, gains by Asia Pacific’s largest capitalised hi-tech hardware stocks in October coincided with 5G roll outs ahead of schedule globally. Significant gains were also observed with a trio of stocks in Singapore with exposure to either semiconductors or their related products in the world of consumer electronics:

  • AEM Holdings (“AEM”) with a 33% gain in October, was ranked #27 by daily trading turnover for the month of October, and has ranked #30 by trading turnover over the first 10 months of 2019. AEM also saw S$42 million in net institutional inflow in October, taking its 10 month net institutional inflow to S$53 million. Substantial shareholder filings have also shown that over recent weeks, UBS Group AG and Morgan Stanley have increased their deemed interests in AEM back above the 5% threshold. After the Friday close, AEM reported 3QFY19 net profit grew 20% YoY (click here fore more). The 3QFY19 report saw a further upward revision in the FY19 revenue guidance to between S$305 million and S$315 million on increased sales orders  This follows S$262 million in revenue in FY18 and S$222 million in revenue in FY17.

  • Hi-P International (“Hi-P”) with 27% gain in October, was ranked #44 by daily trading turnover for the month of October, and has ranked #39 by trading turnover over the first 10 months of 2019. Hi-P also saw S$12 million in net institutional inflow in October, taking its 10 month net institutional inflow to S$25 million. Last week, Hi-P reported its 3QFY19 revenue rose 5% (click here for more). The company reported that net profit declined marginally by 3% attributed to price pressures, higher labour content arising from more complicated manufacturing processes and more stringent quality controls required by customers for certain products along with higher tooling amortizations costs. 

  • UMS Holdings (“UMS”) with 34% gain in October, was ranked #52 by daily trading turnover for the month of October, and has ranked #53 by trading turnover over the first 10 months of 2019. UMS also saw S$18 million in net institutional inflow in October, taking its 10 month net institutional inflow to S$16 million. UMS is expected to reported is 3QFY19 results by Nov 15.


The full list of the 50 most traded stocks, ranked by turnover for October are tabled below. The 50 stocks were recipient to a combined net institutional inflow of S$79 million for the month, bringing their combined net institutional inflow for the 10 months to S$1.1 billion. 

The top performer of the 50 stocks in the month of October was Rex International Holding with a 37% gain, taking its 10 month total return to 95%. On October 16, the Catalist-listed stock announced an oil and gas discovery had been made from exploration and appraisal wells drilled in the Norwegian Sea. Preliminary estimates placed the size of the discovery between 3 and 6 million standard cubic metres or about 19 and 38 million barrels of recoverable oil equivalents. The particular well 6507/5-9 S is named Shrek and located 210 kilometres northwest of Brunoysunn known as the coastal town in the middle of Norway.

Name SGX Code Market
Cap
S$M
October
Total
Return
%
10-Month
Total
Return
%
October
Daily Average
Turnover
Ranking
10-Month
Daily Average
Turnover
Ranking
October
Net
Institutional
Inflow
S$M
10-Month
Net
Institutional
Inflow
S$M
DBS GROUP HOLDINGS D05 66,420 4.0 14.8 1 1 18 (185)
SINGAPORE TELECOMMUNICATIONS Z74 53,886 6.5 16.3 2 2 64 525
UNITED OVERSEAS BANK U11 44,759 4.6 14.6 3 3 48 (102)
OVERSEA-CHINESE BANKING CORP O39 48,269 0.9 1.5 4 4 (45) (232)
KEPPEL CORP BN4 12,460 15.7 20.1 5 12 17 (79)
ASCENDAS REAL ESTATE INV TRT A17U 9,867 1.6 26.7 6 5 (8) 55
MAPLETREE COMMERCIAL TRUST N2IU 7,215 3.3 48.7 7 18 (3) 3
SINGAPORE EXCHANGE S68 9,574 6.5 28.7 8 11 42    422
YANGZIJIANG SHIPBUILDING BS6 3,742 -0.5 -20.9 9 6 (28) (2)
CAPITALAND MALL TRUST C38U 9,369 -2.3 17.1 10 10 (23) (18)
JARDINE MATHESON HLDGS J36 57,361 5.1 -15.7 11 15 5 (10)
HONGKONG LAND HOLDINGS H78 17,608 -3.7 -10.0 12 14 (26) (84)
MAPLETREE LOGISTICS TRUST M44U 6,115 5.4 41.2 13 17 1 38
VENTURE CORP V03 4,566 3.4 18.6 14 13 2 (41)
CAPITALAND COMMERCIAL TRUST C61U 7,907 -1.0 22.7 15 9 1 51
GENTING SINGAPORE G13 11,334 6.8 0.1 16 7 31 (171)
SUNTEC REIT T82U 5,210 -0.9 10.1 17 20 (22) (35)
CAPITALAND C31 18,135 2.0 19.7 18 8 9 161
SINGAPORE TECH ENGINEERING S63 12,443 3.9 18.8 19 21 (5) 167
WILMAR INTERNATIONAL F34 23,761 0.5 23.5 20 16 (11) 183
MAPLETREE INDUSTRIAL TRUST ME8U 5,611 4.9 41.1 21 27 1 19
CITY DEVELOPMENTS C09 9,785 9.9 35.8 22 22 32 115
COMFORTDELGRO CORP C52 4,981 -4.2 11.5 23 19 (19) 66
LENDLEASE GLOBAL COMMERCIAL JYEU 1,110 0.0 N/A 24 72 (21) (21)
MNACT RW0U 4,080 -3.0 17.4 25 24 (22) 5
SINGAPORE PRESS HOLDINGS T39 3,540 6.7 -3.4 26 29 15 20
AEM HOLDINGS AWX 405 32.7 88.8 27 30 42 53
SEMBCORP INDUSTRIES U96 4,093 10.1 -8.4 28 36 (1) (91)
AIMS APAC REIT O5RU 955 -4.9 8.8 29 59 (40) (26)
KEPPEL DC REIT AJBU 3,259 4.7 59.6 30 34 (3) 11
THAI BEVERAGE PCL Y92 22,979 3.4 53.4 31 23 5 203
JARDINE STRATEGIC HLDGS J37 48,748 6.5 -11.2 32 25 4 3
KEPPEL REIT K71U 4,116 -2.9 11.1 33 37 (9) 38
SEMBCORP MARINE S51 2,866 16.1 -11.0 34 35 9 (53)
SINGAPORE AIRLINES C6L 11,152 3.0 2.3 35 26 13 (37)
SATS S58 5,647 4.3 11.3 36 31 12 12
JARDINE CYCLE & CARRIAGE C07 12,932 9.1 -4.1 37 28 7 (7)
FRASERS LOGISTICS & INDUSTRI BUOU 2,834 1.6 28.7 38 33 4 45
DAIRY FARM INTL HLDGS D01 11,099 -5.8 -31.5 39 41   (4) (28)
GOLDEN AGRI-RESOURCES E5H 2,611 -8.9 -14.7 40 43 (12) 5
ASCOTT RESIDENCE TRUST A68U 3,004 4.5 35.7 41 42 11 76
UOL GROUP U14 6,578 4.0 28.9 42 32 13 87
NETLINK NBN TRUST CJLU 3,624 4.5 25.2 43 38 (7) (9)
HI-P INTERNATIONAL H17 1,158 27.4 67.5 44 39 12 25
FRASERS CENTREPOINT TRUST J69U 3,073 1.4 33.2 45 40 3 13
REX INTERNATIONAL HOLDING 5WH 137 37.2 94.5 46 51 1 (1)
EAGLE HOSPITALITY TRUST LIW 662 -17.7 N/A 47 54 (24) (49)
CDL HOSPITALITY TRUSTS J85 1,987 0.0 18.8 48 48 (2) (2)
FRASERS COMMERCIAL TRUST ND8U 1,497 3.4 27.4 49 46 (3) 8
MANULIFE US REAL ESTATE INV BTOU 1,858 1.2 29.7 50 57 0 1
Average: 4.2 19.6 Total: 79 1,128

Source: SGX, Refinitiv, Bloomberg (Data as of 31 October 2019)


This article is provided by SGX My Gateway.


SGX My Gateway

SGX's investor education portal with market, product and investment information and events. Sign up now at sgx.com/mygateway to receive our investment updates and economic calendar.

This document is not intended for distribution to, or for use by or to be acted on by any person or entity located in any jurisdiction where such distribution, use or action would be contrary to applicable laws or regulations or would subject Singapore Exchange Limited (“SGX”) to any registration or licensing requirement. This document is not an offer or solicitation to buy or sell, nor financial advice or recommendation for any investment product. This document is for general circulation only. It does not address the specific investment objectives, financial situation or particular needs of any person. Advice should be sought from a financial adviser regarding the suitability of any investment product before investing or adopting any investment strategies. Use of and/or reliance on this document is entirely at the reader’s own risk. Further information on this investment product may be obtained from www.sgx.com. Investment products are subject to significant investment risks, including the possible loss of the principal amount invested. Past performance of investment products is not indicative of their future performance. Examples provided are for illustrative purposes only. While each of SGX and its affiliates (collectively, the SGX Group Companies) have taken reasonable care to ensure the accuracy and completeness of the information provided, each of the SGX Group Companies disclaims any and all guarantees, representations and warranties, expressed or implied, in relation to this document and shall not be responsible or liable (whether under contract, tort (including negligence) or otherwise) for any loss or damage of any kind (whether direct, indirect or consequential losses or other economic loss of any kind, including without limitation loss of profit, loss of reputation and loss of opportunity) suffered or incurred by any person due to any omission, error, inaccuracy, incompleteness, or otherwise, any reliance on such information, or arising from and/or in connection with this document. The information in this document may have been obtained via third party sources and which have not been independently verified by any SGX Group Company. No SGX Group Company endorses or shall be liable for the content of information provided by third parties. The SGX Group Companies may deal in investment products in the usual course of their business, and may be on the opposite side of any trades. SGX is an exempt financial adviser under the Financial Advisers Act (Cap. 110) of Singapore. The information in this document is subject to change without notice. This document shall not be reproduced, republished, uploaded, linked, posted, transmitted, adapted, copied, translated, modified, edited or otherwise displayed or distributed in any manner without SGX’s prior written consent.


SGX Stock / REIT Search

Advertisement

Trust Bank God Of Fortune Referral Code PGKPSWAE Trust Bank Referral Code 🎁

Advertisement