SGX Market Updates

S-REIT Index’s 5 Best-Performing Constituents Returned 47% in 2019 YTD


PUBLISHED ON |

15 August 2019

  • In 7M2019, Singapore REITs garnered total institutional inflows of S$187.1 million, with two of the seven months – April and July – registering outflows of S$147.9 million and S$209.2 million respectively. 

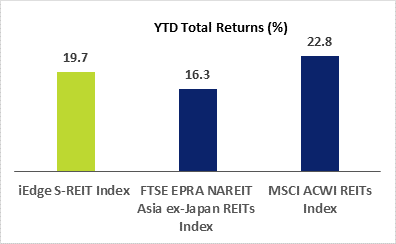
  • In the 2019 YTD, SGX’s iEdge S-REIT Index has clocked total returns of 19.7%, compared with total returns of 16.3% and 22.8% for the FTSE EPRA NAREIT Asia ex-Japan REITs Index and the MSCI ACWI REITs Index respectively, in USD terms. 

  • In the YTD, the five best-performing constituents of the iEdge S-REIT Index were: RHT Health Trust (+98.2%), Ascendas Hospitality Trust (+38.6%), Ascendas India Trust (+35.3%), Lippo Malls Indonesia Retail Trust (+34.9%) and Mapletree Commercial Trust (+30.1%). The five averaged a total return of 47.4% in the YTD.


SGX lists 35 REITs, seven stapled trusts and three property trusts with a combined market cap of over S$100 billion. Between January and July 2019, Singapore REITs garnered total institutional inflows of S$187.1 million, with two of the seven months – April and July – registering outflows of S$147.9 million and S$209.2 million respectively.


institutional fund flow for s-REITs

Source: SGX data


The iEdge S-REIT Index is a free-float, market capitalisation-weighted index that tracks the performance of REITs listed on SGX. The Index’s 36 constituents have a combined market capitalisation of over S$95 billion.

In the 2019 year-to-date, the iEdge S-REIT Index has clocked total returns of 19.7%, compared with total returns of 16.3% and 22.8% for the FTSE EPRA NAREIT Asia ex-Japan REITs Index and the MSCI ACWI REITs Index respectively, in USD terms.


sREITs ytd returns

Source: Bloomberg (data as of 13 Aug 2019)


In the YTD, the five best-performing constituents of the iEdge S-REIT Index were: RHT Health Trust (+98.2%), Ascendas Hospitality Trust (+38.6%), Ascendas India Trust (+35.3%), Lippo Malls Indonesia Retail Trust (+34.9%) and Mapletree Commercial Trust (+30.1%). The five averaged a total return of 47.4% in the YTD, bringing their one-year and three-year total returns to 38.5% and 56.5% respectively.

Four of the five trusts are in the hospitality/tourism, industrial, office and retail segments. Note that RHT Health Trust is a cash trust, after it completed the disposal of its entire portfolio of healthcare assets to its controlling unitholder, Fortis Healthcare, in January this year. In June, Fortis Healthcare said it had aborted plans to sell its stake in RHT and its trustee manager after it failed to receive a commercially viable proposal from potential buyers. RHT’s trustee manager has said it will continue to explore various options for RHT, including identifying possible new businesses that would satisfy SGX’s new listing requirements, or the winding up of the trust. According to listing rules, SGX will remove RHT from its official list if the trust is unable to meet requirements for a new listing within 12 months from the time it becomes a cash trust. 

In the YTD, the five least-performing constituents of the iEdge S-REIT Index were: Frasers Hospitality Trust (+2.4%), ESR-REIT (+6.6%), Soilbuild Business Space REIT (+7.4%), SPH REIT (+10.3%) and Far East Hospitality Trust (+10.4%). These five averaged a 7.4% total return over the period.

The table below details the 20 best-performing constituents of the iEdge S-REIT Index, sorted by YTD total return.

Name SGX
Code
Market
Cap
S$m
Total
Return
YTD
%
Total
Return
1 Yr
%
Total
Return
3 Yr
%
P/B
(x)
Dividend
Ind Yield
%
RHT HEALTH TRUST* RF1U 15 98.2 95.5 113.9 NA NA
ASCENDAS HOSPITALITY TRUST Q1P 1,183 38.6 39.9 72.9 0.9 5.9
ASCENDAS INDIA TRUST CY6U 1,460 35.3 33.8 56.6 1.1 5.2
LIPPO MALLS INDONESIA RETAIL TRUST D5IU 680 34.9 -16.4 -19.9 0.8 8.4
MAPLETREE COMMERCIAL TRUST N2IU 5,878 30.1 39.6 59.0 1.1 4.5
KEPPEL DC REIT AJBU 2,258 28.2 23.6 64.3 1.4 4.6
MAPLETREE LOGISTICS TRUST M44U 5,525 27.4 30.4 74.0 1.0 5.3
FRASERS CENTREPOINT TRUST J69U 2,890 25.6 22.7 44.1 1.1 3.5
ASCOTT RESIDENCE TRUST A68U 2,697 24.9 26.1 39.8 0.8 4.7
FRASERS COMMERCIAL TRUST ND8U 1,479 24.7 25.1 51.4 0.9 5.9
MANULIFE US REIT BTOU 1,696 23.8 11.7 42.6 1.2 5.9
MAPLETREE INDUSTRIAL TRUST ME8U 4,533 23.6 23.0 54.2 1.3 4.1
CAPITALAND COMMERCIAL TRUST C61U 7,865 23.3 26.2 56.5 0.9 4.2
ASCENDAS REIT A17U 9,556 23.1 19.9 48.4 1.2 5.2
SABANA SHARIAH COMPLIANT INDUSTRIAL REIT M1GU 474 21.1 9.5 25.4 0.8 6.3
FRASERS LOGISTICS & INDUSTRIAL TRUST BUOU 2,631 19.5 19.0 44.6 1.1 5.1
CAPITALAND MALL TRUST C38U 9,627 19.4 25.7 42.8 1.0 4.5
OUE COMMERCIAL REIT TS0U 1,532 18.2 -10.4 6.1 0.6 6.1
MAPLETREE NORTH ASIA COMMERCIAL TRUST RW0U 4,263 17.4 19.4 47.0 0.9 6.1
CAPITALAND RETAIL CHINA TRUST AU8U 1,508 17.4 10.9 15.6 0.9 7.5
Average 28.7 23.8 47.0 1.0 5.2

Source: Bloomberg & StockFacts (data as of 13 Aug 2019)
* RHT Health Trust is now a cash trust


This article is provided by SGX My Gateway.


SGX My Gateway

SGX's investor education portal with market, product and investment information and events. Sign up now at sgx.com/mygateway to receive our investment updates and economic calendar.

This document is not intended for distribution to, or for use by or to be acted on by any person or entity located in any jurisdiction where such distribution, use or action would be contrary to applicable laws or regulations or would subject Singapore Exchange Limited (“SGX”) to any registration or licensing requirement. This document is not an offer or solicitation to buy or sell, nor financial advice or recommendation for any investment product. This document is for general circulation only. It does not address the specific investment objectives, financial situation or particular needs of any person. Advice should be sought from a financial adviser regarding the suitability of any investment product before investing or adopting any investment strategies. Use of and/or reliance on this document is entirely at the reader’s own risk. Further information on this investment product may be obtained from www.sgx.com. Investment products are subject to significant investment risks, including the possible loss of the principal amount invested. Past performance of investment products is not indicative of their future performance. Examples provided are for illustrative purposes only. While each of SGX and its affiliates (collectively, the SGX Group Companies) have taken reasonable care to ensure the accuracy and completeness of the information provided, each of the SGX Group Companies disclaims any and all guarantees, representations and warranties, expressed or implied, in relation to this document and shall not be responsible or liable (whether under contract, tort (including negligence) or otherwise) for any loss or damage of any kind (whether direct, indirect or consequential losses or other economic loss of any kind, including without limitation loss of profit, loss of reputation and loss of opportunity) suffered or incurred by any person due to any omission, error, inaccuracy, incompleteness, or otherwise, any reliance on such information, or arising from and/or in connection with this document. The information in this document may have been obtained via third party sources and which have not been independently verified by any SGX Group Company. No SGX Group Company endorses or shall be liable for the content of information provided by third parties. The SGX Group Companies may deal in investment products in the usual course of their business, and may be on the opposite side of any trades. SGX is an exempt financial adviser under the Financial Advisers Act (Cap. 110) of Singapore. The information in this document is subject to change without notice. This document shall not be reproduced, republished, uploaded, linked, posted, transmitted, adapted, copied, translated, modified, edited or otherwise displayed or distributed in any manner without SGX’s prior written consent.


SGX Stock / REIT Search

Advertisement

Trust Bank Referral Code

Advertisement