SGX Market Updates

ROE Highlights of STI’s 10 Largest Industrials Constituents


PUBLISHED ON |

20 August 2019

  • SGX lists more than 200 stocks in the Industrials Sector. The 10 largest capitalised Industrials stocks have a combined market cap of more than S$160 billion, and are constituents of the benchmark STI.

  • Among these 10, the 5 with the highest ROEs are: ST Engineering (22.2%), Venture Corp (16.4%), SATS Ltd (15.1%), Yangzijiang Shipbuilding (13.2%) and ComfortDelGro Corp (11.6%). They have averaged a current ROE of 15.7%.

  • Of the 5, Venture Corp and Yangzijiang Shipbuilding have registered higher ROEs for the latest FY versus their respective 5Y averages, while SATS and ST Engineering have maintained relatively stable ROEs over the periods. 

  • Comparing current ROE levels with 5Y averages provides insight into the company’s track record – stable or rising ROEs indicate that returns are consistently being generated from shareholders’ investments and the business is operating efficiently.


Singapore Exchange lists more than 200 stocks in the Industrials Sector. The 10 largest capitalised Industrials stocks have a combined market capitalisation of more than S$160 billion, and are constituents of the Straits Times Index (STI).

The STI is the most globally recognised benchmark index and market barometer for Singapore. With a history dating back to 1966, the diversified index tracks the performance of the 30 largest and most liquid companies listed on SGX. These 30 constituents have foundations spanning three centuries and multiple sectors, while maintaining a balance between local and regional economic exposures.

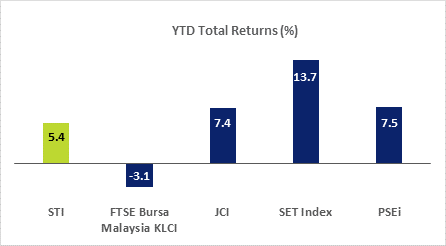
In the 2019 year-to-date, the STI has generated a total return of +5.4%, compared with FTSE Bursa Malaysia Kuala Lumpur Composite Index’s total return of -3.1%, the Jakarta Composite Index’s total return of +7.4%, the Stock Exchange of Thailand Index’s total return of 13.7% and the Philippine Stock Exchange Index’s total return of +7.5%.


YTD Returns ROE Highlights of STIs 10 Largest Industrial

Source: Bloomberg (data as of 16 Aug 2019)


In terms of annualised 10-year total returns, the STI generated a total return of 9.2% over the 2008-2018 period, versus 10.0% for the MSCI ASEAN Index, 7.6% for the MSCI Asia Pacific Index, and 9.8% for the MSCI World Index.


10Y Annualised Total Returns Industrials

Source: Bloomberg


The 10 largest Industrials stocks of the STI are categorised to the following sub-segments: airport and transport services, air freight and logistics, engineering, defence, road and rail services, infrastructure, manufacturing, as well as offshore and marine services. They have averaged a ROE of 11.0%, a YTD total return of -0.5% and a 12-month dividend indicated yield of 3.5%.


Return on Equity (ROE), also known as return on net worth, measures a corporation's profitability by revealing how much earnings a business generates with the money shareholders have invested. ROE is expressed as a percentage and calculated by dividing net income against shareholder's equity, which refers to the company’s net assets, or assets minus liabilities.

The higher the ROE, the more efficient the company's operations are in making use of those funds. ROE is one of the tools by which investors can use to gauge a company’s growth potential – both in terms of earnings as well as share price appreciation. However, note that if the value of shareholder equity falls, ROE gains. Thus, write-downs, share buybacks and high debt levels can artificially boost ROE levels.

Among these 10 largest Industrials stocks, the 5 with the highest ROEs are: ST Engineering (22.2%), Venture Corp (16.4%), SATS Ltd (15.1%), Yangzijiang Shipbuilding (13.2%) and ComfortDelGro Corp (11.6%). They have averaged a current ROE of 15.7%.

Of the 5, 2 – Venture Corp and Yangzijiang Shipbuilding – have registered higher ROEs for the latest financial year versus their respective five-year averages, while another two – SATS and ST Engineering – have maintained relatively stable ROEs over the periods.

Comparing current ROE levels with their five-year averages provides insight into the company’s track record – stable or rising ROEs indicate that returns are consistently being generated from shareholders’ investments and the business is operating efficiently.

In the YTD, these five plays have averaged a total return of 7.2%, bringing their one-year and three-year total returns to 3.8% and 33.3%. They have also averaged a dividend indicated yield of 4.3%. This compares with the STI’s YTD total return of 4.9% and yield of 4.1%.

The tables below detail the 10 largest Industrials stocks of the STI, sorted by current ROE levels.

Name SGX
Code
Market
Cap
S$m
ROE
%
5Y Avg
ROE
(%)
Dividend
Ind Yield
%
ST ENGINEERING S63 12,604 22.2 23.5 3.7
VENTURE CORP V03 4,383 16.4 11.3 4.6
SATS LTD S58 5,289 15.1 15.3 4.0
YANGZIJIANG SHIPBUILDING BS6 3,904 13.2 12.6 4.8
COMFORTDELGRO CORP C52 5,393 11.6 12.6 4.2
KEPPEL CORP BN4 10,701 8.4 10.0 3.9
JARDINE MATHESON * J36 54,670 6.6 10.7 3.2
JARDINE STRATEGIC * J37 49,716 5.9 9.7 1.1
SEMBCORP INDUSTRIES U96 3,986 5.1 8.9 1.8
SINGAPORE AIRLINES C6L 10,594 5.2 5.6 3.4
Average 11.0 12.0 3.5


Name SGX
Code
Market
Cap
S$m
Total
Return
YTD
%
Total
Return
1 Yr
%
Total
Return
3 Yr
%
ST ENGINEERING S63 12,604 18.8 26.1 37.9
VENTURE CORP V03 4,383 12.4 -9.1 82.2
SATS LTD S58 5,289 4.2 -3.6 8.9
YANGZIJIANG SHIPBUILDING BS6 3,904 -18.1 -5.2 40.5
COMFORTDELGRO CORP C52 5,393 18.6 10.9 -2.9
KEPPEL CORP BN4 10,701 3.1 -8.4 23.2
JARDINE MATHESON * J36 54,670 -20.3 -16.4 0.2
JARDINE STRATEGIC * J37 49,716 -9.8 -12.1 7.3
SEMBCORP INDUSTRIES U96 3,986 -11.6 -15.6 -14.0
SINGAPORE AIRLINES C6L 10,594 -2.8 -3.1 -10.3
Average -0.5 -3.6 17.3

Source: Bloomberg & StockFacts (data as of 16 Aug 2019)
* traded in USD, with SGD equivalents shown in table


This article is provided by SGX My Gateway.


SGX My Gateway

SGX's investor education portal with market, product and investment information and events. Sign up now at sgx.com/mygateway to receive our investment updates and economic calendar.

This document is not intended for distribution to, or for use by or to be acted on by any person or entity located in any jurisdiction where such distribution, use or action would be contrary to applicable laws or regulations or would subject Singapore Exchange Limited (“SGX”) to any registration or licensing requirement. This document is not an offer or solicitation to buy or sell, nor financial advice or recommendation for any investment product. This document is for general circulation only. It does not address the specific investment objectives, financial situation or particular needs of any person. Advice should be sought from a financial adviser regarding the suitability of any investment product before investing or adopting any investment strategies. Use of and/or reliance on this document is entirely at the reader’s own risk. Further information on this investment product may be obtained from www.sgx.com. Investment products are subject to significant investment risks, including the possible loss of the principal amount invested. Past performance of investment products is not indicative of their future performance. Examples provided are for illustrative purposes only. While each of SGX and its affiliates (collectively, the SGX Group Companies) have taken reasonable care to ensure the accuracy and completeness of the information provided, each of the SGX Group Companies disclaims any and all guarantees, representations and warranties, expressed or implied, in relation to this document and shall not be responsible or liable (whether under contract, tort (including negligence) or otherwise) for any loss or damage of any kind (whether direct, indirect or consequential losses or other economic loss of any kind, including without limitation loss of profit, loss of reputation and loss of opportunity) suffered or incurred by any person due to any omission, error, inaccuracy, incompleteness, or otherwise, any reliance on such information, or arising from and/or in connection with this document. The information in this document may have been obtained via third party sources and which have not been independently verified by any SGX Group Company. No SGX Group Company endorses or shall be liable for the content of information provided by third parties. The SGX Group Companies may deal in investment products in the usual course of their business, and may be on the opposite side of any trades. SGX is an exempt financial adviser under the Financial Advisers Act (Cap. 110) of Singapore. The information in this document is subject to change without notice. This document shall not be reproduced, republished, uploaded, linked, posted, transmitted, adapted, copied, translated, modified, edited or otherwise displayed or distributed in any manner without SGX’s prior written consent.


SGX Stock / REIT Search

Advertisement

Trust Bank God Of Fortune Referral Code PGKPSWAE Trust Bank Referral Code 🎁

Advertisement