SGX Market Updates

3 Best-Performing Singapore Office REITs Returned 28% in YTD


PUBLISHED ON |

02 July 2019

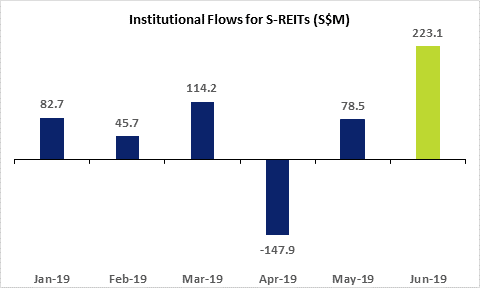
  • Singapore REITs was the top net buy sector in 6M2019, drawing net institutional inflows of S$396.3 million over the period. In June, S-REITs was the top net buy sector, attracting inflows of S$223.1 million, with CapitaLand Commercial Trust topping the net buy list.

  • Of the 34 REITs listed on SGX, 10 are engaged in the acquisition, development, ownership, leasing, management and operation of office properties located in Asia-Pacific, Europe and the US. These 10 office REITs have a market cap of more than S$30 billion.

  • Among the 10 commercial REITs, 6 own Singapore office assets. In Jan-June 2019, the three best performers among the six were: Mapletree Commercial Trust (+29.9%), CapitaLand Commercial Trust (+26.9%) and Frasers Commercial Trust (+26.0%). The trio averaged a YTD total return of 27.6%.


Singapore Exchange lists 34 REITs, seven stapled trusts and three property trusts with a combined market cap of over S$100 billion. Two stapled trusts – ARA US Hospitality Trust and Eagle Hospitality Trust – listed on SGX in May.

Singapore REITs was the top net buy sector in the first six months of 2019, drawing net institutional inflows of S$396.3 million over the period. S-REITs was the top net buy sector in June, after being May’s second top net buy sector. CapitaLand Commercial Trust topped the institutional net buy list in June, drawing inflows of S$58.6 million.


SGX Institutional Flows for S-REITs June 2019

Source: SGX data


Of the 34 REITs on SGX, 10 are engaged in the acquisition, development, ownership, leasing, management and operation of office properties, located in Singapore, Malaysia, South Korea, Australia, Europe, and the United States. These 10 commercial/office REITs have a combined market cap of more than S$30 billion. Among them, Mapletree Commercial Trust and Suntec REIT also have retail assets in their portfolios.

Among them are 6 REITs with Singapore office assets: CapitaLand Commercial Trust, Mapletree Commercial Trust, Suntec REIT, Keppel REIT, Frasers Commercial Trust and OUE Commercial REIT. Over January-June 2019, the 3 best performers among the six were: Mapletree Commercial Trust (+29.9%), CapitaLand Commercial Trust (+26.9%) and Frasers Commercial Trust (+26.0%). The trio averaged a YTD total return of 27.6% and a 12-month dividend indicated yield of 4.7%.

The table below details the six REITs with Singapore office assets, sorted by YTD total return.

Name SGX
Code
Market
Cap
S$m
Total
Return
YTD
%
Total
Return
1 Yr
%
Total
Return
3 Yr
%
12M Div
Ind Yld
(%)
P/B
(x)
MAPLETREE COMMERCIAL TRUST * N2IU 5,963 29.9 41.3 66.3 4.4 1.1
CAPITALAND COMMERCIAL TRUST C61U 8,100 26.9 36.9 79.3 4.0 1.0
FRASERS COMMERCIAL TRUST ND8U 1,522 26.0 30.3 63.8 5.8 0.9
KEPPEL REIT K71U 4,287 13.1 20.1 43.0 4.3 0.8
OUE COMMERCIAL REIT TS0U 1,461 12.6 -11.9 5.1 6.4 0.6
SUNTEC REIT T82U 5,422 12.4 17.5 33.3 5.0 0.9
Average 20.2 22.4 48.5 5.0 0.9

Source: Bloomberg & StockFacts (data as of 28 June 2019)
* Note: VivoCity mall accounts for 48% of the trust’s FY18/19 gross revenue


Office Rentals Seen Climbing Amidst Tapering Supply

According to a report dated 30 May 2019 by UOB-Kay Hian Research, Singapore’s office market, which bottomed out in the first half of 2017, is now in its second year of recovery, and continued upside for office rentals will likely be supported by tapering supply.

Occupancy for Grade A office space within the core Central Business District has seen a V-shaped recovery, rebounding to a healthy 95.2% in 1Q 2019 from the trough of 91.6% in 3Q 2017, the report noted.

New supply for core CBD office space in the city-state is estimated at 5.33 million square feet between 2019 and 2022, representing an average of 1.36 million square feet per annum, 29% below the 10-year average of 1.91 million square feet, it added.

Likewise, in a 21 June 2019 report, Colliers International projected that rents for Grade A office buildings in Singapore’s CBD will rise by 8% this year and 5% in 2020.  It expects new supply in 2019-2021 to average 614,000 square feet per annum or 2% of stock, versus 5% over the past five years. This is anticipated to keep vacancies tight in 2019 through 2021, the report added.

It also noted that growth of the technology, media and telecoms (TMT) and flexible workspace sectors has accounted for most of the net absorption of office space in 2018 and the 2019 year-to-date.


This article is provided by SGX My Gateway.


SGX My Gateway

SGX's investor education portal with market, product and investment information and events. Sign up now at sgx.com/mygateway to receive our investment updates and economic calendar.

This document is not intended for distribution to, or for use by or to be acted on by any person or entity located in any jurisdiction where such distribution, use or action would be contrary to applicable laws or regulations or would subject Singapore Exchange Limited (“SGX”) to any registration or licensing requirement. This document is not an offer or solicitation to buy or sell, nor financial advice or recommendation for any investment product. This document is for general circulation only. It does not address the specific investment objectives, financial situation or particular needs of any person. Advice should be sought from a financial adviser regarding the suitability of any investment product before investing or adopting any investment strategies. Use of and/or reliance on this document is entirely at the reader’s own risk. Further information on this investment product may be obtained from www.sgx.com. Investment products are subject to significant investment risks, including the possible loss of the principal amount invested. Past performance of investment products is not indicative of their future performance. Examples provided are for illustrative purposes only. While each of SGX and its affiliates (collectively, the SGX Group Companies) have taken reasonable care to ensure the accuracy and completeness of the information provided, each of the SGX Group Companies disclaims any and all guarantees, representations and warranties, expressed or implied, in relation to this document and shall not be responsible or liable (whether under contract, tort (including negligence) or otherwise) for any loss or damage of any kind (whether direct, indirect or consequential losses or other economic loss of any kind, including without limitation loss of profit, loss of reputation and loss of opportunity) suffered or incurred by any person due to any omission, error, inaccuracy, incompleteness, or otherwise, any reliance on such information, or arising from and/or in connection with this document. The information in this document may have been obtained via third party sources and which have not been independently verified by any SGX Group Company. No SGX Group Company endorses or shall be liable for the content of information provided by third parties. The SGX Group Companies may deal in investment products in the usual course of their business, and may be on the opposite side of any trades. SGX is an exempt financial adviser under the Financial Advisers Act (Cap. 110) of Singapore. The information in this document is subject to change without notice. This document shall not be reproduced, republished, uploaded, linked, posted, transmitted, adapted, copied, translated, modified, edited or otherwise displayed or distributed in any manner without SGX’s prior written consent.


SGX Stock / REIT Search

Advertisement

Trust Bank God Of Fortune Referral Code PGKPSWAE Trust Bank Referral Code 🎁

Advertisement