SGX Market Updates

SGX's Real Estate, Manufacturing and F&B Shares on the Move in 1H19


PUBLISHED ON |

12 June 2019

  • Real Estate, Manufacturing and Food & Beverage stocks made up close to half of Singapore’s top 200 stocks by turnover in the first 5 months of 2019. The stocks representing tech–laden Manufacturing were the best performers in 2019 YTD and preceding two years, with F&B the best performer in 2016.

  • Distinct drivers of the three sectors included interest rate outlooks and property prices for Real Estate, technological advancements, value chain integration and global trade for Manufacturing while incomes, tastes, preferences and tourism drove Food & Beverage sales. 

  • Real estate stocks showed the most consistency in returns, with the least standard deviation amongst the individual stock performances, followed by food & beverage stocks, with the individual manufacturing stocks showing the most performance deviation in past years. 

  • Returns amongst the relevant 23 manufacturing stocks have been more constant in the 2019 YTD, with the 18% average total return generated by  19 gainers and four decliners, and a median total return of 19%. Hi-P Int, Frencken & Sunpower led the manufacturers over the 23 weeks.


As 2019 rapidly approaches the halftime mark of 30 June, clear drivers of investor sentiment in the year thus far have included concerns of global growth deceleration at home and abroad, resumption of trade frictions amongst the world’s two largest economies in early May, and a more dovish outlook for US interest rates.

In Singapore, the Straits Times index (“STI”) has generated  a total return of 6.8% in the 2019 year-to-date, in-line with the FTSE ASEAN All Share Index which has gained 7.4%.

Looking beyond the STI, the 200 most actively traded stocks have generated an average total return of 8.0%. This does not include the average total returns of RHT Health Trust, Memtech International and Indofood Agri Resources which averaged 89.2% gains on premium cash offers for these businesses.


60 Real Estate Stocks Amongst Top 200 Stocks by Turnover

Singapore’s strong property and infrastructure fundamentals have provided beachheads for Singapore’s listed Real Estate Sector. For the first 5 months of 2019, the 60 Real Estate stocks amongst the 200 most active traded stocks by turnover accounted for the most day-to-day market turnover, which was followed by Financial Services. As discussed recently (see SGX Market Update: 5 Property Acquisitions Expected to Boost S-REIT Yields) this year Singapore REITs have attracted investment flows from global funds which has included private equity funds.

The 23 manufacturing stocks that were amongst the 200 stocks by turnover accounted for the most day-to-day turnover after the 11 financial services stocks. After Real Estate’s 60 stocks, the 23 manufacturing stocks led by the likes of Yangzijiang Shipbuilding, Venture Corporation and Singapore Tech Engineering, contributed the next most number of stocks in the top 200 by turnover. Note these manufacturing stocks do not include Food Manufacturers or Processors, and span diverse business from advanced electronics to healthcare products.

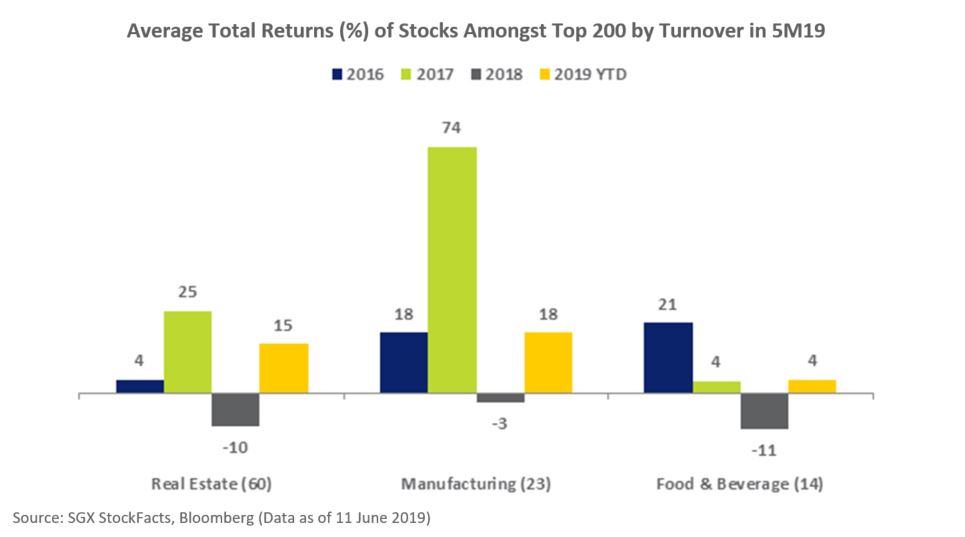
With Food and Beverage (“F&B”) contributing 14 stocks to the top 200 by turnover, and the next highest number of stocks after Manufacturing, the three sectors of Real Estate, Manufacturing and F&B together made up 97 stocks. This was close to half the top 200 stocks by turnover. The average total returns of the three genres of stocks over recent years are illustrated in the chart below. 


Total Returns of Three Genres


The average total returns illustrated above were built on various levels of consistency across the performances of each of the Sector’s stocks. For instance, the 60 real estate stocks showed the most consistency, with the least standard deviation amongst the individual stock performances in all four time periods.

This was followed by F&B, which saw more consistency in the performances across its relevant 14 stocks than Manufacturing over the past three years ending 2018. As noted above, Singapore manufacturing stocks span a wide range of industries, with the diversification exponentiated by the geographical reach of these businesses. This was a contributing factor to the individual manufacturing stocks showing the most performance deviation over the preceding three years.  However, in the 2019 year to date, performances across manufacturing stocks have seen marginally less deviation than the F&B stocks. 

The comparative performances of the relevant stocks are tabled below, with each table sorted by stocks with the most turnover over the first five months of 2019.  The 60 real estate stocks maintain a combined market capitalisation of S$175 billion, the 23 manufacturing stocks maintain a total market capitalisation of S$35 billion and the 14 F&B stocks maintain a total market capitalisation of S$60 billion. Note the designated F&B stocks do not include Palm Oil producers.

Real Estate Stock Code 2016
Total
Return
%
2017
Total
Return
%
2018
Total
Return
%
2019 to
11 June
Total
Return
%
ASCENDAS REAL ESTATE INV TRT A17U 4.6 27.4 0.3 18.7
CAPITALAND C31 -7.2 20.1 -9.0 13.4
CAPITALAND COMMERCIAL TRUST C61U 16.6 42.1 -5.0 19.3
CAPITALAND MALL TRUST C38U 3.0 19.5 12.7 16.3
MAPLETREE LOGISTICS TRUST M44U 10.8 38.7 1.5 24.9
HONGKONG LAND HOLDINGS H78 -4.8 5.5 -6.1 10.8
CITY DEVELOPMENTS C09 10.3 53.1 -33.8 12.9
SUNTEC REIT T82U 13.2 37.6 -12.8 9.5
MAPLETREE COMMERCIAL TRUST N2IU 14.9 23.0 7.6 25.5
UOL GROUP U14 -1.5 51.2 -28.8 18.7
MAPLETREE NORTH ASIA COMMERC RW0U 11.7 38.3 -1.1 22.9
KEPPEL REIT K71U 17.0 30.1 -5.2 11.3
MAPLETREE INDUSTRIAL TRUST ME8U 15.8 32.2 -0.7 15.5
FRASERS LOGISTICS & INDUSTRI BUOU 0.0 34.0 -4.2 19.1
KEPPEL DC REIT AJBU 26.1 27.0 -0.7 24.6
FRASERS CENTREPOINT TRUST J69U 9.1 24.8 2.2 20.3
ASCOTT RESIDENCE TRUST A68U 2.4 20.2 -6.1 22.6
FRASERS COMMERCIAL TRUST ND8U 7.0 27.1 -1.7 17.7
CDL HOSPITALITY TRUSTS J85 8.7 39.9 -8.6 13.6
YANLORD LAND GROUP Z25 33.1 25.6 -21.6 7.9
CAPITALAND RETAIL CHINA TRUS AU8U -1.0 29.4 -12.5 16.3
ESR-REIT J91U 3.6 12.0 -1.8 12.7
CROMWELL EUROPEAN REIT CNNU 0.0 0.0 -13.3 16.0
STARHILL GLOBAL REIT P40U 4.7 11.6 -6.5 13.7
YING LI INTERNATIONAL REAL E 5DM -10.2 1.3 -23.2 20.7
CACHE LOGISTICS TRUST K2LU -3.5 19.0 -12.2 12.4
FAR EAST HOSPITALITY TRUST Q5T -3.1 27.9 -10.8 9.8
MANULIFE US REAL ESTATE INV BTOU 0.0 18.3 -7.2 18.5
ASCENDAS INDIA TRUST CY6U 23.3 19.1 0.2 27.7
OUE HOSPITALITY TRUST SK7 -1.1 38.2 -16.0 6.6
SASSEUR REAL ESTATE INVESTME CRPU 0.0 0.0 0.0 31.7
OXLEY HOLDINGS 5UX 1.0 71.9 -44.7 8.0
SPH REIT SK6U 5.4 16.8 0.6 7.8
APAC REALTY CLN 0.0 0.0 -46.4 27.8
HONG FOK CORP H30 -2.4 38.2 -19.9 23.9
ASCENDAS HOSPITALITY TRUST Q1P 2.9 30.8 -3.6 25.8
LIPPO MALLS INDONESIA RETAIL D5IU 27.3 17.5 -50.6 28.6
WING TAI HOLDINGS W05 -6.1 47.1 -11.8 5.2
KEPPEL-KBS US REIT CMOU 0.0 0.0 -23.9 28.3
FRASERS HOSPITALITY TRUST ACV -1.8 29.3 -4.7 4.6
AIMS APAC REIT O5RU 3.4 13.5 3.9 10.1
ACCORDIA GOLF TRUST ADQU 31.0 17.0 -21.1 11.1
OUE COMMERCIAL REAL ESTATE I TS0U 14.6 11.0 -22.6 9.3
SOILBUILD BUSINESS SPACE REI SV3U -8.7 14.2 -6.2 8.9
OUE LJ3 0.5 8.2 -22.2 12.2
FRASERS PROPERTY TQ5 -1.2 39.0 -17.4 15.1
SABANA SHARIAH COMP IND REIT M1GU -33.5 12.2 6.8 18.2
TUAN SING HOLDINGS T24 -10.6 60.8 -18.9 2.3
GUOCOLAND F17 4.4 28.1 -16.3 10.0
EC WORLD REIT BWCU 0.0 8.0 -1.2 16.1
DASIN RETAIL TRUST CEDU 0.0 0.0 7.3 5.4
BUKIT SEMBAWANG ESTATES B61 6.7 47.1 -7.0 -1.4
IREIT GLOBAL UD1U 12.9 17.3 0.8 8.1
HO BEE LAND H13 3.8 24.3 0.1 4.5
PROPNEX OYY 0.0 0.0 0.0 18.2
UNITED INDUSTRIAL CORP U06 -2.8 20.6 -16.8 8.9
FORTUNE REIT F25U 17.5 8.0 -0.4 23.6
BOUSTEAD SINGAPORE F9D -0.6 9.8 -3.4 -2.5
SINGHAIYI GROUP 5H0 -13.4 30.7 -22.5 11.8
CENTURION CORP OU8 -10.7 65.9 -16.5 1.1
Average:   4.1 24.7 -10.0 14.7


Manufacturing Stock Code 2016
Total
Return
%
2017
Total
Return
%
2018
Total
Return
%
2019 to
11 June
Total
Return
%
YANGZIJIANG SHIPBUILDING BS6 -22.3 86.3 -11.4 19.2
VENTURE CORP V03 28.0 115.4 -29.1 19.1
SINGAPORE TECH ENGINEERING S63 12.3 5.0 11.8 20.3
AEM HOLDINGS AWX 195.3 498.6 1.5 22.4
SEMBCORP MARINE S51 -19.3 34.9 -15.9 -1.9
HI-P INTERNATIONAL H17 4.6 326.5 -50.8 57.1
VALUETRONICS HOLDINGS BN2 34.3 103.5 -22.8 -2.3
SUNPOWER GROUP 5GD 57.4 -11.6 -27.6 53.0
CREATIVE TECHNOLOGY C76 -11.9 10.9 254.2 0.5
FRENCKEN GROUP E28 30.3 132.4 -18.9 53.9
HAW PAR CORP H02 14.9 27.2 7.9 18.8
SUNNINGDALE TECH BHQ 22.4 83.6 -21.9 -2.8
FU YU CORP F13 27.2 6.6 10.1 13.2
SARINE TECHNOLOGIES U77 20.9 -42.4 -52.0 -29.2
RIVERSTONE HOLDINGS AP4 -25.0 25.6 7.9 -17.9
INNOTEK M14 48.6 32.7 18.3 30.0
MANUFACTURING INTEGRATION TE M11 -25.7 48.3 18.1 22.0
CHUAN HUP HOLDINGS C33 -15.7 37.5 -3.7 32.1
JEP HOLDINGS 1J4 -31.0 86.2 -3.6 12.6
HANWELL HOLDINGS DM0 -9.4 31.3 -43.6 41.5
MIYOSHI M03 19.0 62.8 -39.6 4.9
AVARGA U09 64.7 1.8 -23.4 20.7
HALCYON AGRI CORP 5VJ -8.3 -5.7 -29.8 24.4
Average:   17.9 73.8 -2.8 17.9


F & B Stock Code 2016
Total
Return
%
2017
Total
Return
%
2018
Total
Return
%
2019 to
11 June
Total
Return
%
THAI BEVERAGE PCL Y92 27.2 11.3 -31.7 40.8
WILMAR INTERNATIONAL F34 25.0 -12.1 4.3 10.8
SATS S58 30.9 10.9 -7.2 8.2
JAPFA UD2 94.0 -42.8 44.6 -19.6
OLAM INTERNATIONAL O32 12.2 6.5 -15.9 15.7
KOUFU GROUP VL6 0.0 0.0 0.0 14.8
SINO GRANDNESS FOOD INDUSTRY T4B -33.8 -8.9 -38.2 -61.0
DELFI P34 12.0 -35.1 -5.3 -6.8
QAF Q01 37.8 -16.4 -45.0 36.5
JUMBO GROUP 42R 49.4 -9.6 -31.4 1.7
FRASER AND NEAVE F99 2.8 26.0 -32.1 4.4
BREADTALK GROUP CTN 5.4 52.1 -1.6 -2.5
JB FOODS BEW 32.0 69.2 38.7 11.3
KIMLY 1D0 0.0 0.0 -30.6 2.8
Average:   21.1 3.7 -10.8 4.1

Source: SGX StockFacts, Bloomberg (Data as of 11 June 2019). Note TR = Total Return which assumes dividends are reinvested.


Distinct drivers of the three sectors included interest rate outlooks and property prices for real estate, technological advancements, value chain integration and global trade for manufacturing while incomes, tastes, preferences and tourism drive F&B sales.


This article is provided by SGX My Gateway.


SGX My Gateway

SGX's investor education portal with market, product and investment information and events. Sign up now at sgx.com/mygateway to receive our investment updates and economic calendar.

This document is not intended for distribution to, or for use by or to be acted on by any person or entity located in any jurisdiction where such distribution, use or action would be contrary to applicable laws or regulations or would subject Singapore Exchange Limited (“SGX”) to any registration or licensing requirement. This document is not an offer or solicitation to buy or sell, nor financial advice or recommendation for any investment product. This document is for general circulation only. It does not address the specific investment objectives, financial situation or particular needs of any person. Advice should be sought from a financial adviser regarding the suitability of any investment product before investing or adopting any investment strategies. Use of and/or reliance on this document is entirely at the reader’s own risk. Further information on this investment product may be obtained from www.sgx.com. Investment products are subject to significant investment risks, including the possible loss of the principal amount invested. Past performance of investment products is not indicative of their future performance. Examples provided are for illustrative purposes only. While each of SGX and its affiliates (collectively, the SGX Group Companies) have taken reasonable care to ensure the accuracy and completeness of the information provided, each of the SGX Group Companies disclaims any and all guarantees, representations and warranties, expressed or implied, in relation to this document and shall not be responsible or liable (whether under contract, tort (including negligence) or otherwise) for any loss or damage of any kind (whether direct, indirect or consequential losses or other economic loss of any kind, including without limitation loss of profit, loss of reputation and loss of opportunity) suffered or incurred by any person due to any omission, error, inaccuracy, incompleteness, or otherwise, any reliance on such information, or arising from and/or in connection with this document. The information in this document may have been obtained via third party sources and which have not been independently verified by any SGX Group Company. No SGX Group Company endorses or shall be liable for the content of information provided by third parties. The SGX Group Companies may deal in investment products in the usual course of their business, and may be on the opposite side of any trades. SGX is an exempt financial adviser under the Financial Advisers Act (Cap. 110) of Singapore. The information in this document is subject to change without notice. This document shall not be reproduced, republished, uploaded, linked, posted, transmitted, adapted, copied, translated, modified, edited or otherwise displayed or distributed in any manner without SGX’s prior written consent.


SGX Stock / REIT Search

Advertisement

Trust Bank God Of Fortune Referral Code PGKPSWAE Trust Bank Referral Code 🎁

Advertisement