SGX Market Updates

Highlights of China-Related S-REITs and Developers


PUBLISHED ON |

15 February 2019

  • The 10 REITs on SGX that report revenues to China have a combined market cap of nearly S$18 billion. S-REITs were among the best-performing sectors in the months of Nov, Dec and Jan. S-REITs was also the top net buy sector last month, garnering net institutional inflows of S$82.7 million.

  • Among these 10 China-related REITs, the 5 best performers in the YTD were: Mapletree North Asia (+10.5%), OUE Commercial (+10.4%), Ascott Residence (+9.2%), Mapletree Logistics (+8.8%), and EC World REIT (+8.0%). They averaged a total return of +9.4% in the YTD.

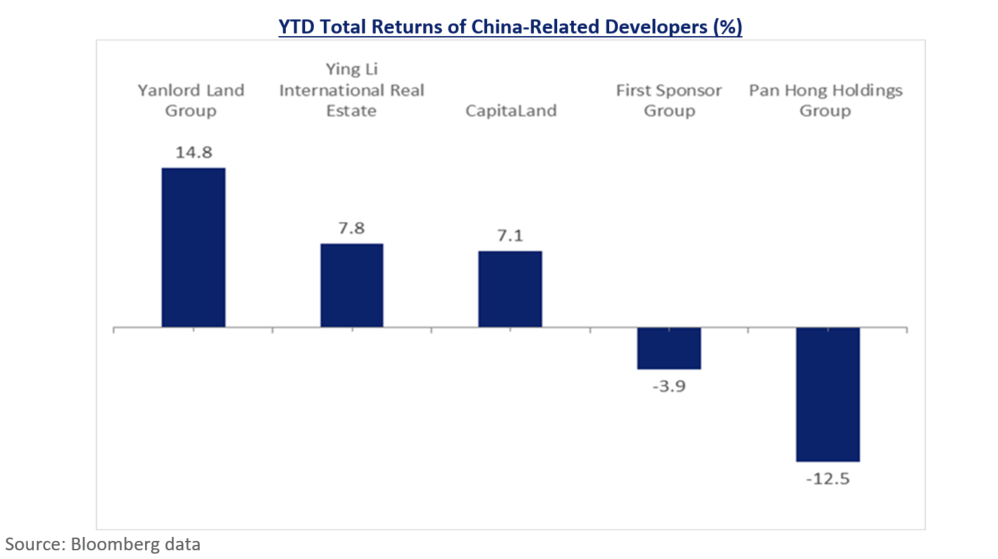
  • The 5 largest real estate developers on SGX that report more than one-third of total revenues to China have a combined market cap of about S$18 billion. In the YTD, the three best performers were: Yanlord Land (+14.8%), Ying Li (+7.8%), and CapitaLand (+7.1%).


There are 34 Real Estate Investment Trusts (REITs), 5 Stapled Trusts and 3 property trusts listed on SGX. The sector has a combined market capitalisation of close to S$90 billion, with Retail, Industrial and Office REITs making up the largest segments.

Amidst a challenging market environment, Singapore REITs were among the best-performing sectors on SGX for three consecutive months, registering total returns of 2.3%, 0.3% and 7.9% respectively in November, December and January. REITs was also the top net buy sector last month, garnering net institutional inflows of S$82.7 million, SGX data showed.

Analysts have noted revived investor interest in S-REITs since the fourth quarter of 2018, driven by a flight to safety amidst rising risk-aversion, as US-Sino trade tensions continued to simmer, and global equity markets remained volatile.

The relatively strong fundamentals of S-REITs – about 80% of the trusts across various segments have hedged at least 70% of their debt with fixed rates, while all are required by regulation to have a maximum gearing ratio of 45% – should also help mitigate the negative impact of a rising interest-rate environment.

There are 10 REITs listed on SGX that report revenues to China, and they have a combined market capitalisation of nearly S$18 billion. These 10 trusts have averaged a total return of +6.6% in the 2019 year-to-date and a dividend yield of 7.2%.

In the YTD, the five best-performing REITs with China revenues were: Mapletree North Asia Commercial Trust (+10.5%), OUE Commercial REIT (+10.4%), Ascott Residence Trust (+9.2%), Mapletree Logistics Trust (+8.8%), and EC World REIT (+8.0%). These 5 REITs have averaged a total return of +9.4% in the YTD, bringing their one-year and three-year total returns to +4.9% and +43.7% respectively.

YTD Total Returns of Best-Performing China-Related REITs (%)


The table below details the 10 REITs on SGX that report revenues to China, sorted by YTD total returns.

Name SGX
Code
Market
Cap
S$m
2019 YTD
Total
Returns
(%)
1Y
Total
Return
(%)
3Y
Total
Return
(%)
Dividend
Yield
P/B
(x)
% Revenue
from China
Mapletree North Asia Commercial Trust RW0U 3,926 10.5 13.0 90.8 5.8 1.0 30.7
OUE Commercial REIT TS0U 1,415 10.4 -16.1 16.2 7.5 0.7 18.1
Ascott Residence Trust A68U 2,477 9.2 3.7 33.5 6.2 0.8 10.5
Mapletree Logistics Trust M44U 4,847 8.8 16.7 78 6.4 1.1 6.6
EC World REIT BWCU 590 8.0 7.4 0.0 7.0 0.9 100
CapitaLand Retail China Trust AU8U 1,363 5.7 -3.2 26.3 7.2 0.9 100
Sasseur REIT CRPU 808 5.4 0.0 0.0 - 0.9 100
Starhill Global REIT P40U 1,505 3.1 -0.6 13.6 8.2 0.8 2.3
BHG Retail Trust BMGU 368 2.1 4.7 9.9 8.8 0.9 100
Dasin Retail Trust CEDU 491 1.7 14.3 0.0 7.8 0.6 100
Average 6.5 4.0 26.8 7.2 0.8

Source: SGX StockFacts and Bloomberg (Data as of 13 February 2019)

Note:

  • Mapletree North Asia Commercial Trust, Starhill Global REIT, CapitaLand Retail China Trust, Sasseur REIT, Dasin Retail Trust and BHG Retail Trust are involved in the leasing and operation of retail property and infrastructure in China and HK.

  • OUE Commercial REIT owns an office and retail property in Shanghai.

  • Ascott Residence Trust owns seven serviced residences in cities across China.

  • Mapletree Logistics Trust and EC World REIT manage diversified portfolios focused on e-commerce, shipping, logistics and supply chain management.


As for real estate developers on SGX, the 5 largest that report more than one-third of their total revenues to China have a combined market capitalisation of S$17.7 billion. Among these 5 developers, the 3 best performers in the YTD were: Yanlord Land (+14.8%), Ying Li International (+7.8%), and CapitaLand (+7.1%). Note that Yanlord and Ying Li reported 100% of their revenues to China, while CapitaLand and First Sponsor reported 27.04% and 32.24% revenues to China respectively.

YTD Total Returns of China-Related Developers (%)


The table below details the five real estate developers that report revenues to China, sorted by YTD total returns.

Name SGX
Code
Market
Cap
S$m
2019 YTD
Total
Returns
(%)
1Y
Total
Return
(%)
3Y
Total
Return
(%)
Dividend
Yield
P/E
(x)
Yanlord Land Group Z25 2,704 14.8 -9.5 41.9 4.7 2.8
Ying Li Intl Real Estate 5DM 320 7.8 -8.1 -3.1 - 6.9
CapitaLand * C31 13,862 7.1 -2.3 28.9 3.6 9.6
First Sponsor Group ^ ADN 798 -3.9 -5.7 15.4 1.7 9.2
Pan Hong Holdings P36 36 -12.5 -16.8 50.5 20.3 -
Average 2.6 -8.5 26.7 7.1 7.1

Source: SGX StockFacts and Bloomberg (Data as of 13 February 2019)
* Reported 27.0% revenue to China in last FY.
^ Reported 32.2% revenue to China in last FY.


China’s Growth Outlook

Earlier this week, China posted a surprise 9.1% YoY jump in its January exports, surpassing most economists’ forecasts of a contraction. This comes after its December exports unexpectedly shrank 4.4% YoY, the most in two years.

This year, the World Bank expects a further slowdown in the world’s second-largest economy, as headwinds increase amidst heightened trade tensions. The agency has forecast economic growth of 6.2% in 2019, slightly below previous projections as a result of weaker exports, and down from 6.5% expansion in 2018, it said in the January edition of its “Global Economic Prospects” report.

Between 1999 and 2014, China has averaged a significantly stronger annual economic growth rate of 9.6%, reaching as high as over 14% in 2007. In recent years, the moderation in its economic growth rates, which still remain above the developing-economy average, has coincided with the government’s policy of pursuing high-quality, rather than high-speed, growth.


This article is provided by SGX My Gateway.


SGX My Gateway

SGX's investor education portal with market, product and investment information and events. Sign up now at sgx.com/mygateway to receive our investment updates and economic calendar.

This document is not intended for distribution to, or for use by or to be acted on by any person or entity located in any jurisdiction where such distribution, use or action would be contrary to applicable laws or regulations or would subject Singapore Exchange Limited (“SGX”) to any registration or licensing requirement. This document is not an offer or solicitation to buy or sell, nor financial advice or recommendation for any investment product. This document is for general circulation only. It does not address the specific investment objectives, financial situation or particular needs of any person. Advice should be sought from a financial adviser regarding the suitability of any investment product before investing or adopting any investment strategies. Use of and/or reliance on this document is entirely at the reader’s own risk. Further information on this investment product may be obtained from www.sgx.com. Investment products are subject to significant investment risks, including the possible loss of the principal amount invested. Past performance of investment products is not indicative of their future performance. Examples provided are for illustrative purposes only. While each of SGX and its affiliates (collectively, the SGX Group Companies) have taken reasonable care to ensure the accuracy and completeness of the information provided, each of the SGX Group Companies disclaims any and all guarantees, representations and warranties, expressed or implied, in relation to this document and shall not be responsible or liable (whether under contract, tort (including negligence) or otherwise) for any loss or damage of any kind (whether direct, indirect or consequential losses or other economic loss of any kind, including without limitation loss of profit, loss of reputation and loss of opportunity) suffered or incurred by any person due to any omission, error, inaccuracy, incompleteness, or otherwise, any reliance on such information, or arising from and/or in connection with this document. The information in this document may have been obtained via third party sources and which have not been independently verified by any SGX Group Company. No SGX Group Company endorses or shall be liable for the content of information provided by third parties. The SGX Group Companies may deal in investment products in the usual course of their business, and may be on the opposite side of any trades. SGX is an exempt financial adviser under the Financial Advisers Act (Cap. 110) of Singapore. The information in this document is subject to change without notice. This document shall not be reproduced, republished, uploaded, linked, posted, transmitted, adapted, copied, translated, modified, edited or otherwise displayed or distributed in any manner without SGX’s prior written consent.


SGX Stock / REIT Search

Advertisement

Trust Bank Referral Code

Advertisement