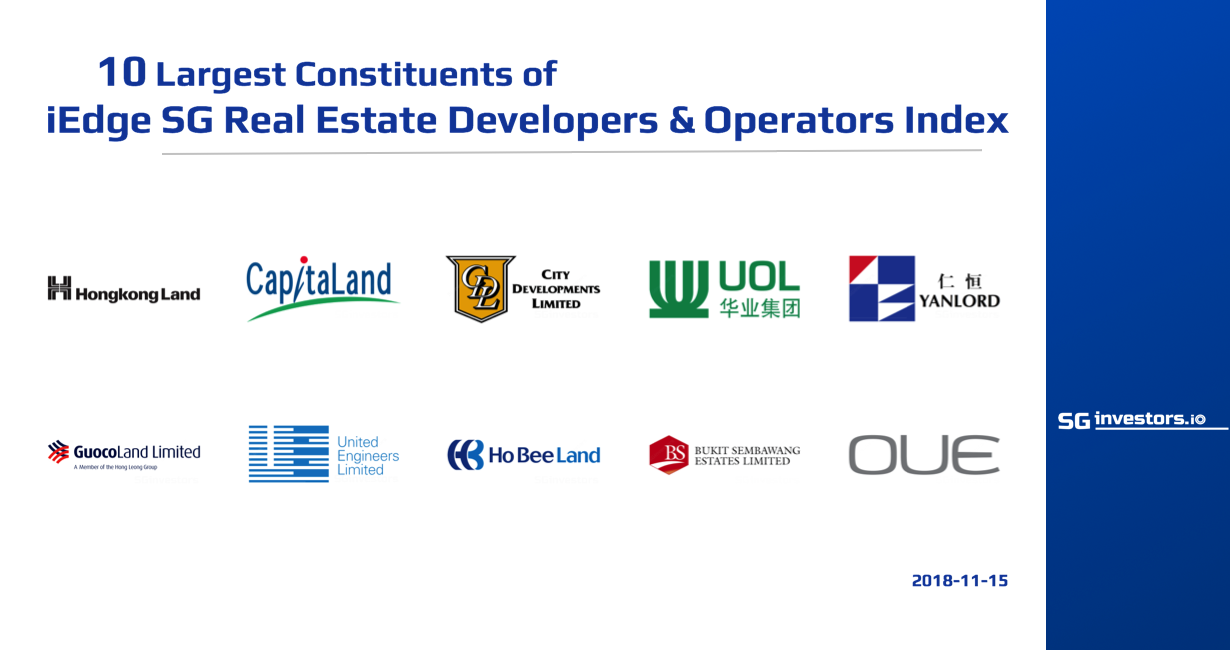
The iEdge SG Real Estate Developers & Operators Index is a free-float, market capitalisation-weighted index that measures the performance of listed real estate developers and operators in Singapore. The Index currently comprises 20 constituents, after Wheelock Properties was delisted on 18 Oct 2018.
The Index's 10 largest constituents, with a combined market capitalisation of S$56 billion, have averaged a 6% price rebound from their 12M troughs. In particular, Ho Bee Land, City Developments and Yanlord Land each have registered price gains of 9% from their 52-week lows.
In the 2018 YTD, the Index's 10 largest constituents have averaged a total return of -15%, bringing their 3Y and 5Y total returns to +15% and +14% respectively. They have also averaged a dividend indicated yield of 2.8% and a P/B ratio of 0.6x.
The iEdge SG Real Estate Developers & Operators Index is a free-float, market capitalisation-weighted index that measures the performance of listed real estate developers and operators in Singapore.
The Index currently comprises 20 constituents, after Wheelock Properties Singapore was delisted on 18 October 2018, following its Hong Kong-listed parent Wheelock & Co Ltd’s privatisation offer at S$2.10 per share.
The 10 largest constituents of the iEdge SG Real Estate Developers & Operators Index, with a combined market capitalisation of S$56.4 billion, have averaged a 5.6% price rebound from their 12-month troughs. In particular, Ho Bee Land, City Developments and Yanlord Land have registered price gains of 8.9%, 8.8% and 8.6% respectively from their 52-week lows. The 52-week lows for the 10 largest real estate developer stocks ranged from early July to the end of October. The majority of the price troughs were seen over the last few days of October.
In the 2018 year-to-date, the 10 largest constituents of the iEdge SG Real Estate Developers & Operators Index have averaged a total return of -14.7%, bringing their three-year and five-year total returns to +14.5% and +13.5% respectively. They have also averaged a dividend indicated yield of 2.8% and a price-to-book ratio of 0.6x.
The table below details the 10 largest constituents of the iEdge SG Real Estate Developers & Operators Index, sorted by market cap. Click on the stock name to view its profile in StockFacts.
Name | SGX Code |
Weighting (%) |
Market Cap S$(M) |
Last Price (S$) |
52W Low Price (S$) |
52W Low Date |
Price Chg vs 52W Low (%) |
---|---|---|---|---|---|---|---|
Hongkong Land* | H78 | 9.95 | 20,110.8 | 8.55 | 8.13 | 10/31/2018 | 5.2% |
CapitaLand Ltd | C31 | 9.85 | 12,946.4 | 3.11 | 2.98 | 07/06/2018 | 4.4% |
City Developments | C09 | 9.86 | 7,699.6 | 8.49 | 7.80 | 10/31/2018 | 8.8% |
UOL Group | U14 | 9.78 | 5,258.5 | 6.24 | 5.98 | 10/31/2018 | 4.3% |
Yanlord Land | Z25 | 7.84 | 2,433.7 | 1.26 | 1.16 | 10/26/2018 | 8.6% |
Guocoland Ltd | F17 | 4.68 | 2,047.1 | 1.73 | 1.67 | 10/31/2018 | 3.6% |
United Engineers | U04 | 8.29 | 1,638.4 | 2.57 | 2.40 | 09/13/2018 | 7.1% |
Ho Bee Land | H13 | 4.10 | 1,623.1 | 2.44 | 2.24 | 07/06/2018 | 8.9% |
Bukit Sembawang Estates | B61 | 9.75 | 1,405.9 | 5.43 | 5.21 | 07/09/2018 | 4.2% |
OUE Ltd | LJ3 | 4.28 | 1,235.1 | 1.37 | 1.36 | 10/26/2018 | 0.7% |
Average | 5.6 |
Name | SGX Code |
Weight (%) |
Total Return YTD % |
Total Return 3Y (%) |
Total Return 5Y (%) |
Dvd Ind Yld % |
P/B (x) |
---|---|---|---|---|---|---|---|
Hongkong Land* | H78 | 9.95 | -6.5 | -11.1 | 25.2 | 3.2 | 0.4 |
CapitaLand Ltd | C31 | 9.85 | -9.0 | 9.2 | 18.2 | 3.8 | 0.7 |
City Developments | C09 | 9.86 | -30.8 | 15.9 | -8.9 | 0.9 | 0.8 |
UOL Group | U14 | 9.78 | -28.2 | 4.5 | 12.1 | 2.8 | 0.6 |
Yanlord Land | Z25 | 7.84 | -19.1 | 29.5 | 12.1 | 5.4 | 0.5 |
Guocoland Ltd | F17 | 4.68 | -19.6 | 5.0 | -10.7 | 4.1 | 0.5 |
United Engineers | U04 | 8.29 | -1.2 | 42.0 | 67.3 | 1.6 | 0.8 |
Ho Bee Land | H13 | 4.10 | 3.1 | 35.0 | 40.2 | 3.3 | 0.5 |
Bukit Sembawang Estates | B61 | 9.75 | -10.6 | 34.6 | 12.1 | 0.7 | 1.1 |
OUE Ltd | LJ3 | 4.28 | -25.4 | -19.1 | -32.8 | 2.2 | 0.3 |
Average | -14.7 | 14.5 | 13.5 | 2.8 | 0.6 |
Among the 20 constituents of the iEdge SG Real Estate Developers & Operators Index, the five developers that registered the strongest rebound in their share prices from 52-week lows were: Imperium Crown (+66.7%), Yoma Strategic (+37.5%), LHN (+27.5%), Chip Eng Seng (+12.5%), and Sing Holdings (+9.9%).
The table below details the five constituents of the iEdge SG Real Estate Developers & Operators Index that posted the strongest price rebounds from their 52-week lows.
Name | SGX Code |
Weighting (%) |
Market Cap S$(M) |
Last Price (S$) |
52W Low Price (S$) |
52W Low Date |
Price Chg vs 52W Low (%) |
---|---|---|---|---|---|---|---|
Imperium Crown | 5HT | 0.12 | 27.6 | 0.035 | 0.021 | 10/25/2018 | 66.7 |
Yoma Strategic | Z59 | 4.69 | 625.6 | 0.330 | 0.240 | 10/25/2018 | 37.5 |
LHN Ltd | 41O | 0.33 | 78.5 | 0.195 | 0.153 | 06/29/2018 | 27.5 |
Chip Eng Seng | C29 | 3.49 | 450.7 | 0.720 | 0.640 | 10/30/2018 | 12.5 |
Sing Holdings | 5IC | 1.01 | 156.4 | 0.390 | 0.355 | 10/25/2018 | 9.9 |
Name | SGX Code |
Market Cap S$(M) |
Total Return YTD % |
Total Return 3Y (%) |
Total Return 5Y (%) |
Dvd Ind Yld % |
P/B (x) |
---|---|---|---|---|---|---|---|
Imperium Crown | 5HT | 27.6 | -47.8 | -46.6 | -20.6 | NA | 0.4 |
Yoma Strategic | Z59 | 625.6 | -38.5 | -32.3 | -48.8 | 0.7 | 0.9 |
LHN Ltd | 41O | 78.5 | -16.1 | 53.9 | NA | 1.0 | 0.9 |
Chip Eng Seng | C29 | 450.7 | -23.0 | 23.9 | 33.7 | 5.5 | 0.6 |
Sing Holdings | 5IC | 156.4 | -10.4 | 41.1 | 8.6 | 2.6 | 0.6 |
Performance of Singapore’s Residential Sector
Despite a noticeable slowing in Singapore’s residential market after the government’s latest slew of cooling measures in July, prices are still edging higher, but at the slowest pace in around five quarters.
- In the July to September quarter, private residential prices inched up 0.5%, compared with the 3.4% gain in the April to June quarter, Urban Redevelopment Authority (URA) data released last month showed. Landed properties rose 2.3% in 3Q18, compared with the 4.1% increase in 2Q18. Prices of non-landed properties were unchanged, compared with the 3.2% gain in the previous quarter.
- After home prices rose more than 7% in the first six months of 2018, the government in July introduced fresh property curbs. They included higher additional buyers' stamp duty (ABSD) for Singaporeans and Permanent Residents buying their second home onwards and foreigners buying residential property, as well as tightened Loan-to-Value (LTV) limits.
- Nonetheless, demand remains fairly resilient, albeit on a selective basis. DBS Group Research noted in a report published last week that three residential properties launched for sale, as well as two released for previews, over the weekend saw “respectable” sell-through rates – at 22% to 41%. It added that smaller units continue to be best-sellers, while strategically located developments continue to be well-sought after.
As a result of the government’s cooling measures and a higher interest-rate environment, mortgage loans have also slowed, Fitch Solutions noted in a report released last week.
- Since the curbs were introduced in July, the growth of housing and bridging loans have eased to 3.5% YoY in September from a high of 4.8% YoY in May, and “a further slowdown is likely, as seen from previous episodes when property curbs were tightened", Fitch noted. As a result, it has cut its 2018 and 2019 loan growth forecasts for Singapore banks to 4% and 3% respectively, from 5% and 4.5% previously.
- Since January 2017, the Federal Reserve has raised US interest rates six times – with the most recent hike in September. The Fed has signalled its intention to raise rates again on 18/19 December, and three more times next year, as it assumes the world’s largest economy continues to grow moderately and inflation remains in check.