SGX Market Updates

Highlights of Singapore's 10 Largest OSV Players


PUBLISHED ON |

16 February 2017

  • Singapore's 32 Offshore Supply Vessels (OSV) stocks have rebounded 17.2% in the year-to-date in tandem with the recent oil price rally.

  • OSVs are one of the key beneficiaries of a crude oil price recovery. The 10 biggest OSV stocks listed on SGX have averaged a YTD total return of 28.9%, against total returns of 0.9% for the SGX MOE Index, a benchmark for the MOE Sector.

  • Despite the rally, the outlook for Singapore’s OSV stocks remains challenging. OSV companies with low gearing levels, high cash balances and strong operating cash flows are better positioned to ride out the storm, industry analysts say.


OSVs – A Better Proxy to Rising Crude Prices

Offshore Support Vessels (OSVs) players, being heavily dependent on the fortunes of the crude market, are one of the key beneficiaries of a rebound in oil prices. A robust demand for oil leads to an increase in planned E&P activities, resulting in higher demand for rigs, platforms and FPSOs, which in turn boosts the OSV market.

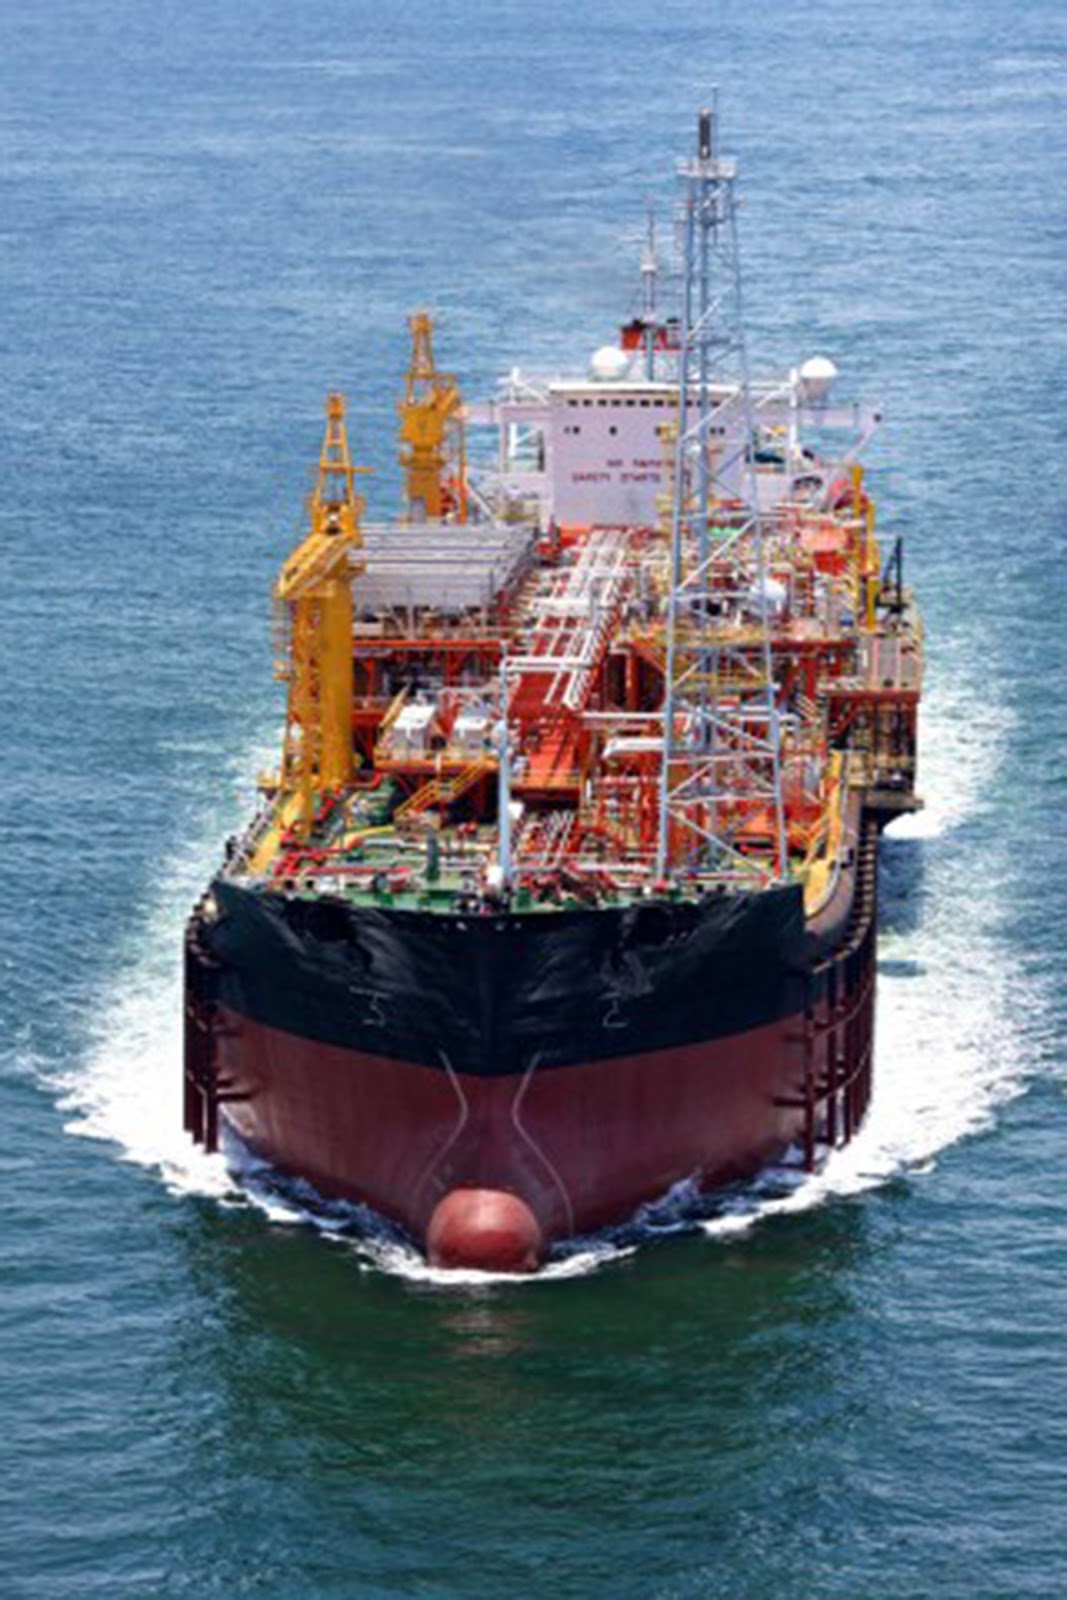
OSVs generally provide support services to offshore drilling rigs, pipe laying and oil producing assets – including production platforms as well as floating production, storage and offloading (FPSO) units – used in the exploration and production (E&P) of oil and gas.

Although WTI Crude Oil prices have rallied 25% from early September lows last year to hover around US$50-$55 bbl levels currently, the outlook for Singapore OSVs remains difficult, industry analysts say. Refinancing continues to be a risk for highly leveraged companies and more corporate failures cannot be ruled out. Globally, consolidations are also happening, and most recently, Norway is seeing three of its biggest OSV players merging to create one of the biggest fleets in the sector.

According to industry analysts, investors should look out for OSV companies with low gearing levels, high cash balances and strong operating cash flows, as these companies would be better positioned to ride out the industry storm and emerge stronger in a market upturn.


High Sensitivity to Crude Recovery

In the year-to-date, the 10 biggest OSV stocks on SGX have averaged a total return of 28.9%, outperforming the SGX MOE Index which generated a total return of 0.9%. The performances of the 10 largest OSV stocks reflect the trend of upstream players being the first to benefit from an oil price recovery. Over the past one year, the 10 largest OSV stocks from both Singapore have generated total returns of 52.4%. In terms of valuations, the 10 biggest OSV stocks averaged a price-to-book ratio of 1.0x.

The table below details the 10 largest stocks in the SGX Offshore Support Vessels sector, sorted by market capitalisation. To see more details on each stock in SGX StockFacts, click on the stock name.

Name SGX
Code
Last
Traded
Price
S$
Market Cap
S$M
Total
Return
YTD
%
Total
Return
1 Yr
%
ROE
%
ROE
5 Yr Avg
%
Dvd Ind
Yld %
P/B
Ezion Holdings 5ME 0.38 788 -1.3 -16.8 -1.4 18.2 N/A 0.4
PACC Offshore U6C 0.38 689 18.8 37.6 -15.7 N/A 1.3 0.5
Civmec P9D 0.69 343 29.2 94.2 6.3 30.0 1.0 2.0
Mermaid Maritime DU4 0.23 325 53.3 98.3 -50.1 -8.6 N/A 0.7
CH Offshore C13 0.25 176 -10.7 -35.9 1.8 10.8 N/A N/A
Charisma Energy 5QT 0.01 144 83.3 0.0 13.8 N/A N/A 1.4
Jasper Investments FQ7 0.03 140 73.7 312.5 N/A N/A N/A N/A
Nordic Group MR7 0.33 130 32.0 93.8 20.5 13.0 3.6 2.1
Falcon Energy 5FL 0.15 119 -2.6 -14.9 3.1 N/A N/A N/A
Pacific Radiance T8V 0.16 113 12.9 -44.7 -23.0 13.1 6.3 0.2
Average 28.9 52.4 -5.0 12.8 3.1 1.0

Source: SGX, Bloomberg & SGX StockFacts (data as of 15 February 2017)


Ezion Holdings

For the nine months ending 30 September 2016, Ezion Holdingsreported revenue of USD 245.6 million compared to USD 266.4 million a year ago. Operating profit was USD 52.5 million compared to USD 97.9 million a year ago. Profit after tax was USD 33.0 million compared to USD 100.3 million a year ago.

For its balance sheet as at 30 September 2016, the Group noted total liabilities of USD 1,794 million was lower than the USD 1,867 million as at end FY2015 due to repayment of loans due to banks and the completion of the sale of assets held for sale.

Outlook from management in press release (Source: Ezion Holdings press release)

  • Expects the current challenges facing the Marine and Offshore Oil and Gas Industry (the Offshore Industry) to continue at least into 2017
  • At current oil prices, we are seeing pockets of renewed optimism that is translating into enquiries and requirements for additional Service Rigs
  • Plans to modify a few more of its existing Service Rigs and also take delivery of up to two or three new units before the end of 2017

For more information click here. Ezion will report its full year results on 23 Feb 2017.


PACC Offshore Services Holdings (POSH)

In the group’s Q3 2016 results, the company reported revenue of USD 41.6 million against USD 80.4 million a year ago and net loss of USD 12.7 million against net profit of USD 13.1 million a year ago due to unfavourable market conditions. The 48% decline in revenue is largely due to lower utilisation and charter rates across the major business segments.

Outlook from management in press release (Source: POSH press release)

  • business environment for the remainder of 2016 and 2017 will remain challenging and could potentially deteriorate further.
  • However, we [POSH] maintained a sound balance sheet… and will be well positioned when the market recovers eventually.

The group reported a net operating cash flow of USD39.1 million for 9M FY2016, with a net gearing of 0.6x as at the end of September 2016. This is compared to USD30.7 million a year ago. For more information click here.


Civmec

For the two quarters ending 31 December 2016, Civmec reported revenue of SGD 174.1 million compared to SGD 235.4 million a year ago. Operating profit was SGD 21.8 million compared to SGD 29.3 million a year ago. Profit after tax was SGD 6.6 million compared to SGD 13.5 million a year ago.

For its balance sheet as at 31 December 2016, the Group noted total borrowings of SGD 41.2 million was higher than the SGD 32.1 million as at end FY2016 due to repayment of loans due to capital expenditure associated with the development of the property in Newcastle.

Outlook from management in press release (Source: Civmec press release)

  • remains positive about the medium to long-term outlook and is strategically positioned to capitalise on the S$800 billion pipeline of capital spend in Australia
  • continue to actively explore business opportunities abroad via the entities established in Uganda and Papua New Guinea.

For more information click here.


OSV Players in SGX MOE Index

Since its recent trough in September 2016, the SGX Maritime & Offshore Services (MOE) Index has rebounded about 17%, tracking the recovery in crude prices. As discussed here, the SGX MOE Index can be seen as a performance benchmark for the listed maritime and offshore services companies in Singapore. It consists of 18 companies with a combined market cap of about S$30 billion.

Of the 18 constituents within the Index, seven are OSV players – Ausgroup, Ezion Holdings, Ezra Holdings, IEV Holdings, Nordic Group, Pacific Radiance and Vallianz Holdings. 


This article is provided by SGX My Gateway.


SGX My Gateway

SGX's investor education portal with market, product and investment information and events. Sign up now at sgx.com/mygateway to receive our investment updates and economic calendar.

This document is not intended for distribution to, or for use by or to be acted on by any person or entity located in any jurisdiction where such distribution, use or action would be contrary to applicable laws or regulations or would subject Singapore Exchange Limited (“SGX”) to any registration or licensing requirement. This document is not an offer or solicitation to buy or sell, nor financial advice or recommendation for any investment product. This document is for general circulation only. It does not address the specific investment objectives, financial situation or particular needs of any person. Advice should be sought from a financial adviser regarding the suitability of any investment product before investing or adopting any investment strategies. Use of and/or reliance on this document is entirely at the reader’s own risk. Further information on this investment product may be obtained from www.sgx.com. Investment products are subject to significant investment risks, including the possible loss of the principal amount invested. Past performance of investment products is not indicative of their future performance. Examples provided are for illustrative purposes only. While each of SGX and its affiliates (collectively, the SGX Group Companies) have taken reasonable care to ensure the accuracy and completeness of the information provided, each of the SGX Group Companies disclaims any and all guarantees, representations and warranties, expressed or implied, in relation to this document and shall not be responsible or liable (whether under contract, tort (including negligence) or otherwise) for any loss or damage of any kind (whether direct, indirect or consequential losses or other economic loss of any kind, including without limitation loss of profit, loss of reputation and loss of opportunity) suffered or incurred by any person due to any omission, error, inaccuracy, incompleteness, or otherwise, any reliance on such information, or arising from and/or in connection with this document. The information in this document may have been obtained via third party sources and which have not been independently verified by any SGX Group Company. No SGX Group Company endorses or shall be liable for the content of information provided by third parties. The SGX Group Companies may deal in investment products in the usual course of their business, and may be on the opposite side of any trades. SGX is an exempt financial adviser under the Financial Advisers Act (Cap. 110) of Singapore. The information in this document is subject to change without notice. This document shall not be reproduced, republished, uploaded, linked, posted, transmitted, adapted, copied, translated, modified, edited or otherwise displayed or distributed in any manner without SGX’s prior written consent.


SGX Stock / REIT Search

Advertisement

Trust Bank God Of Fortune Referral Code PGKPSWAE Trust Bank Referral Code 🎁

Advertisement